3501 - 3975 Grand Park Dr
Listing History
Unit Highlights
Maintenance Fees
Utility Type
- Air Conditioning
- Central Air
- Heat Source
- Gas
- Heating
- Forced Air
Room Dimensions
About this Listing
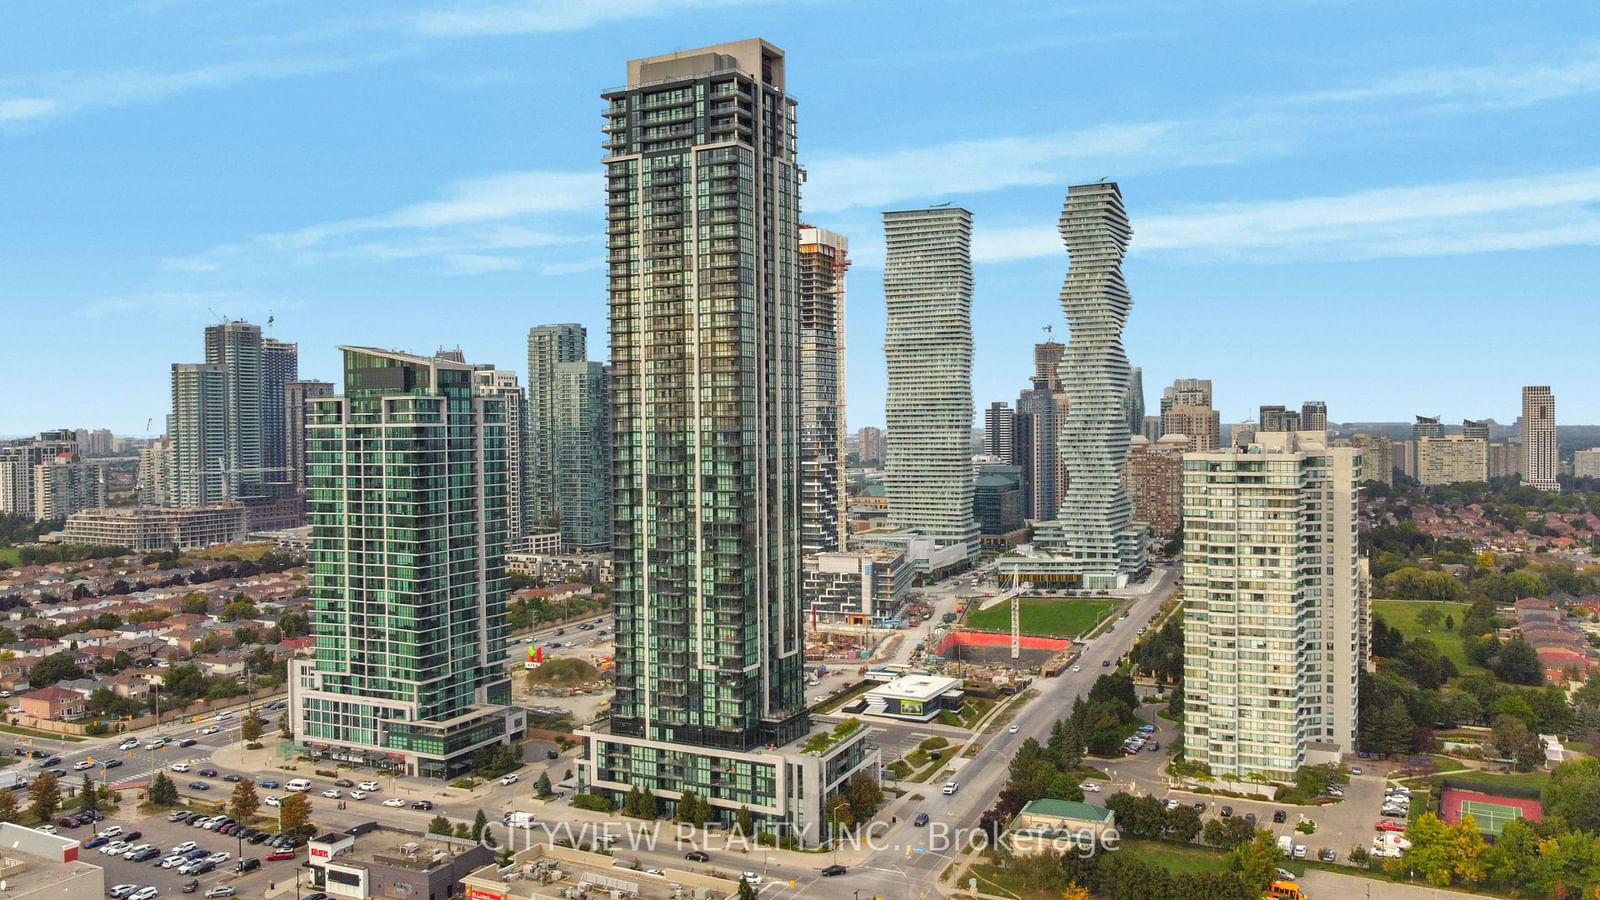
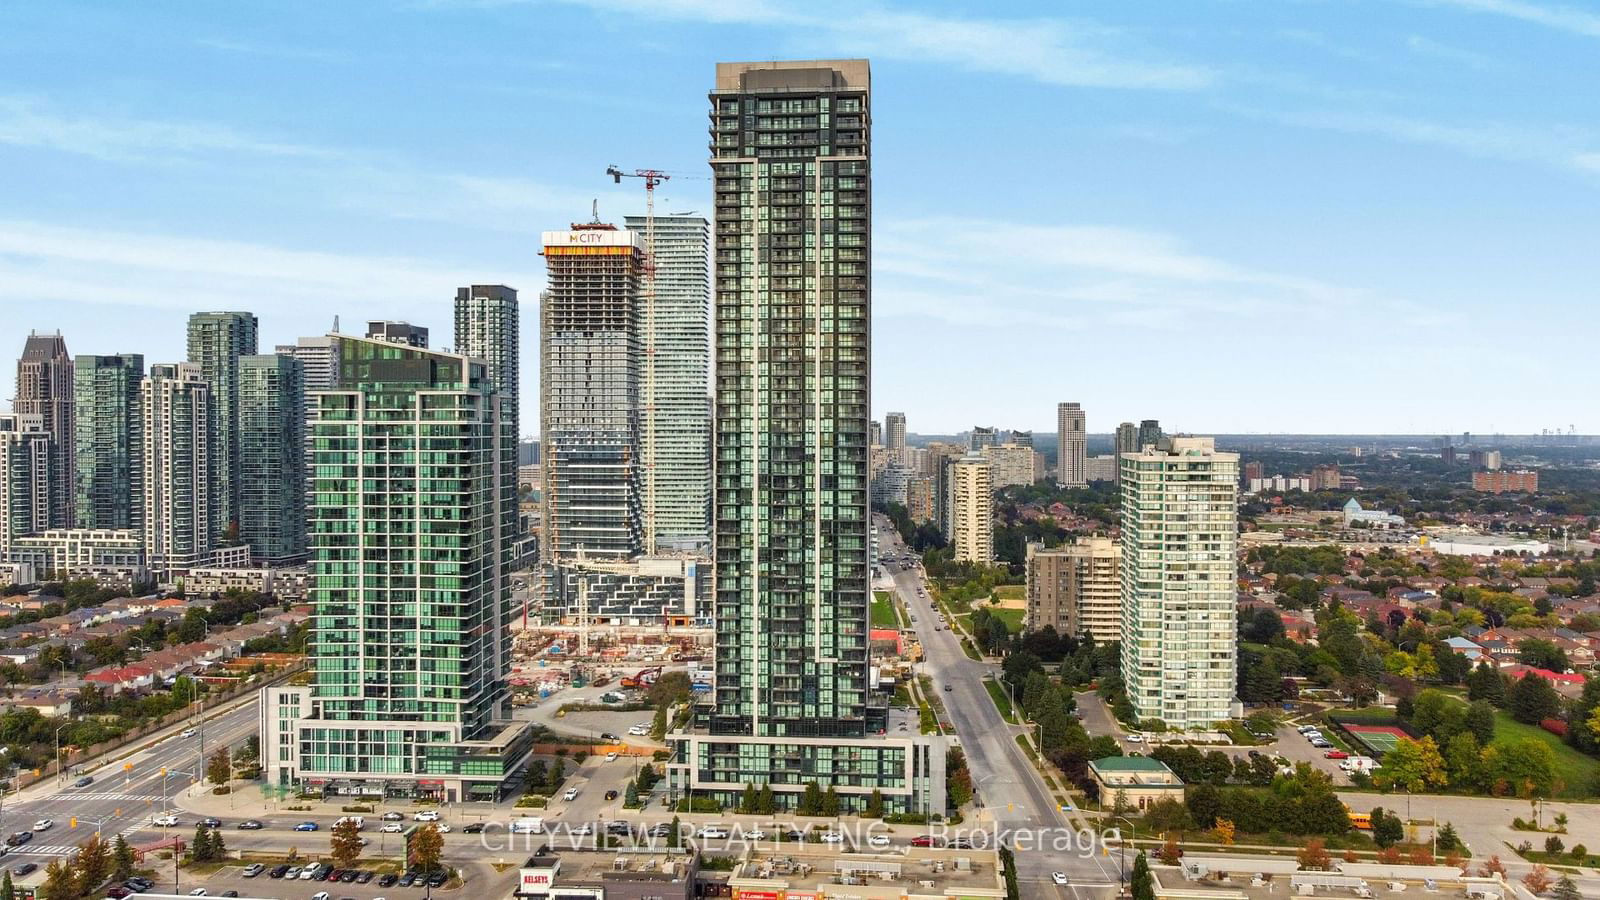
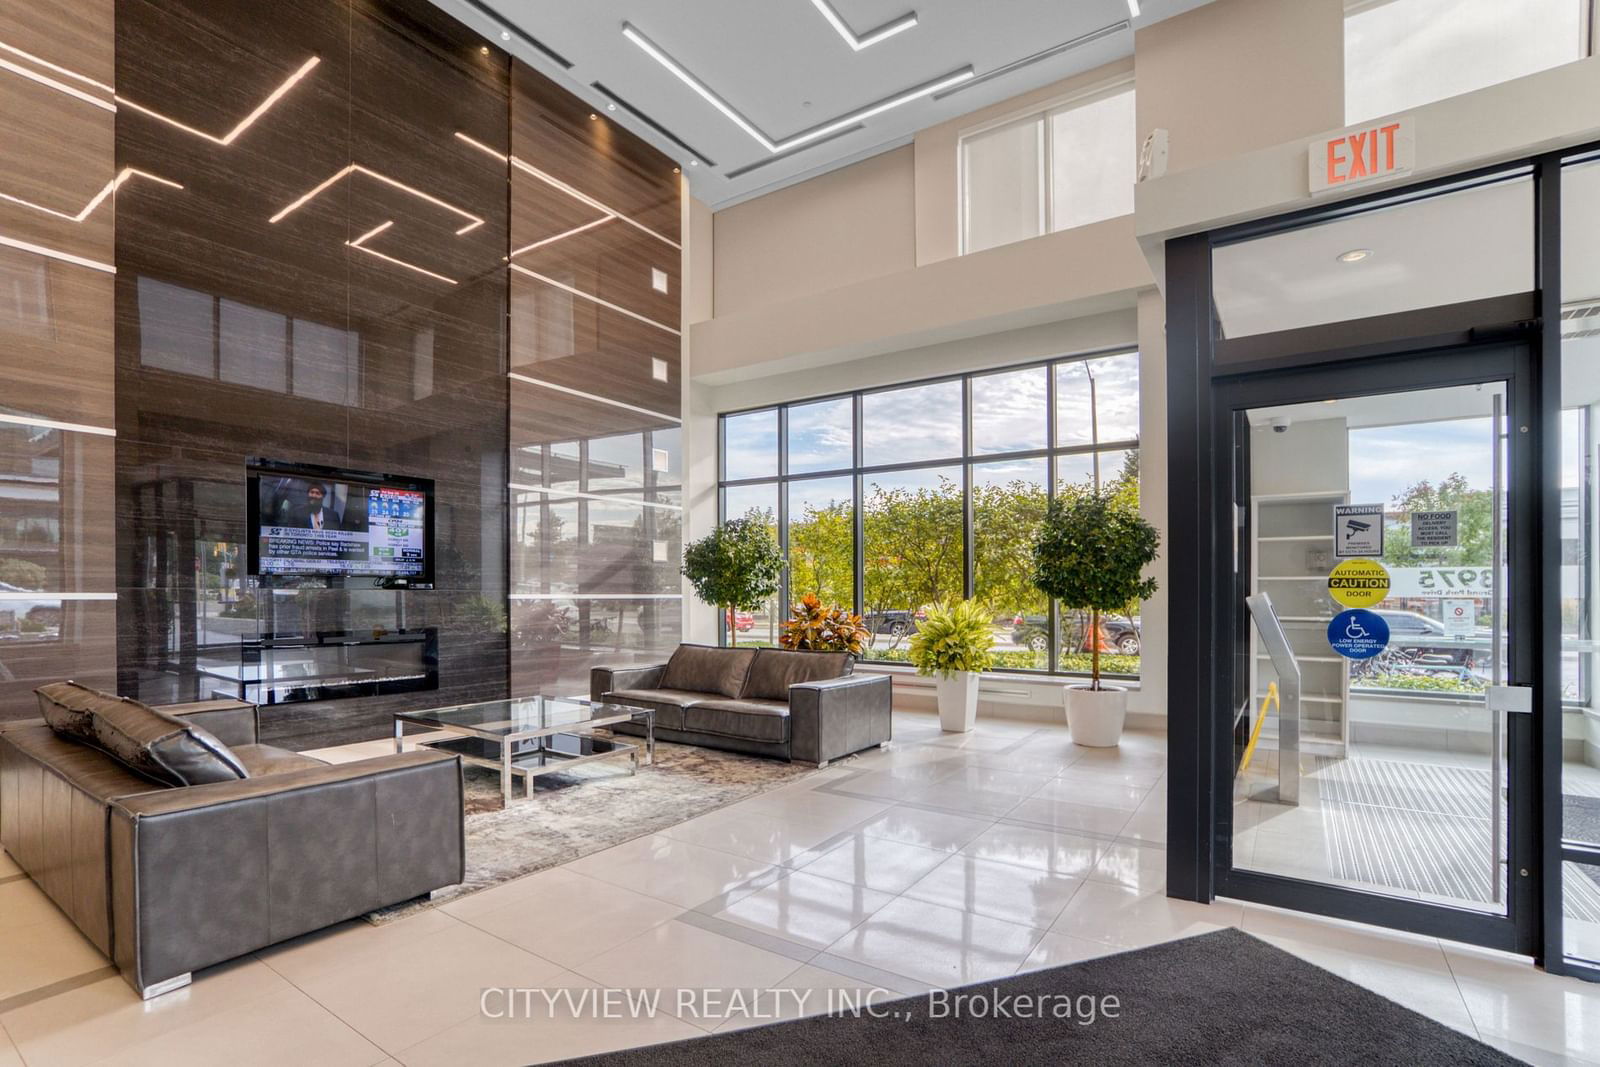
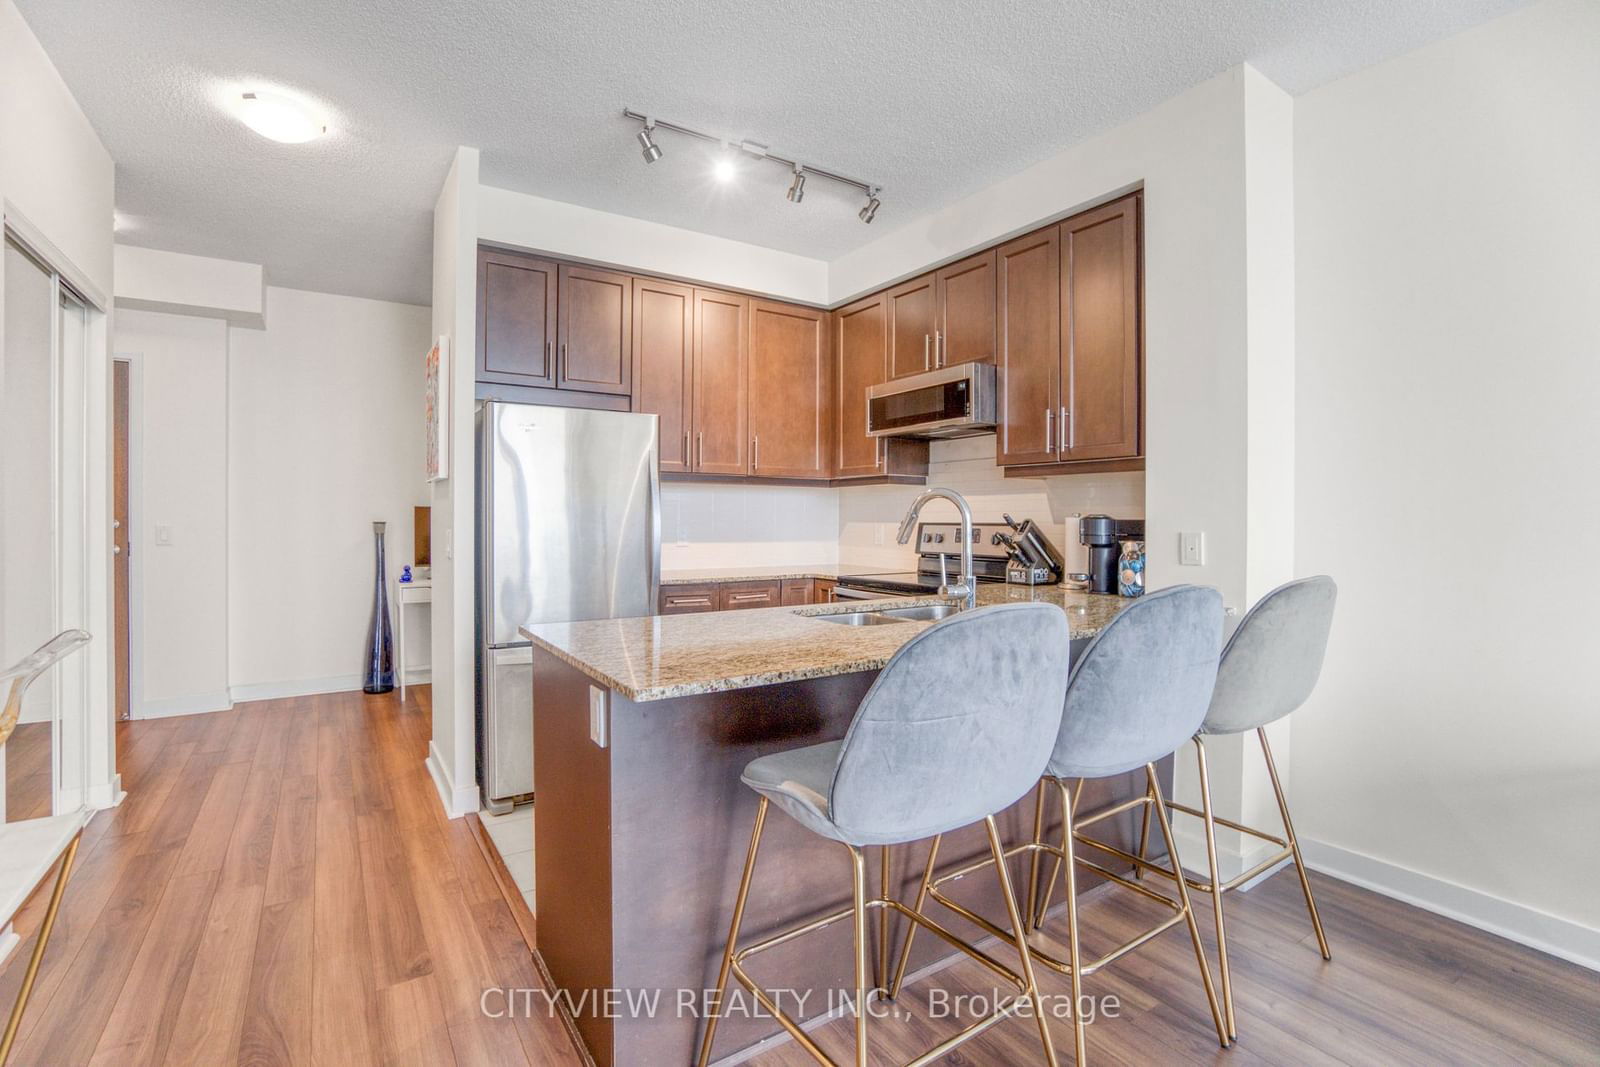
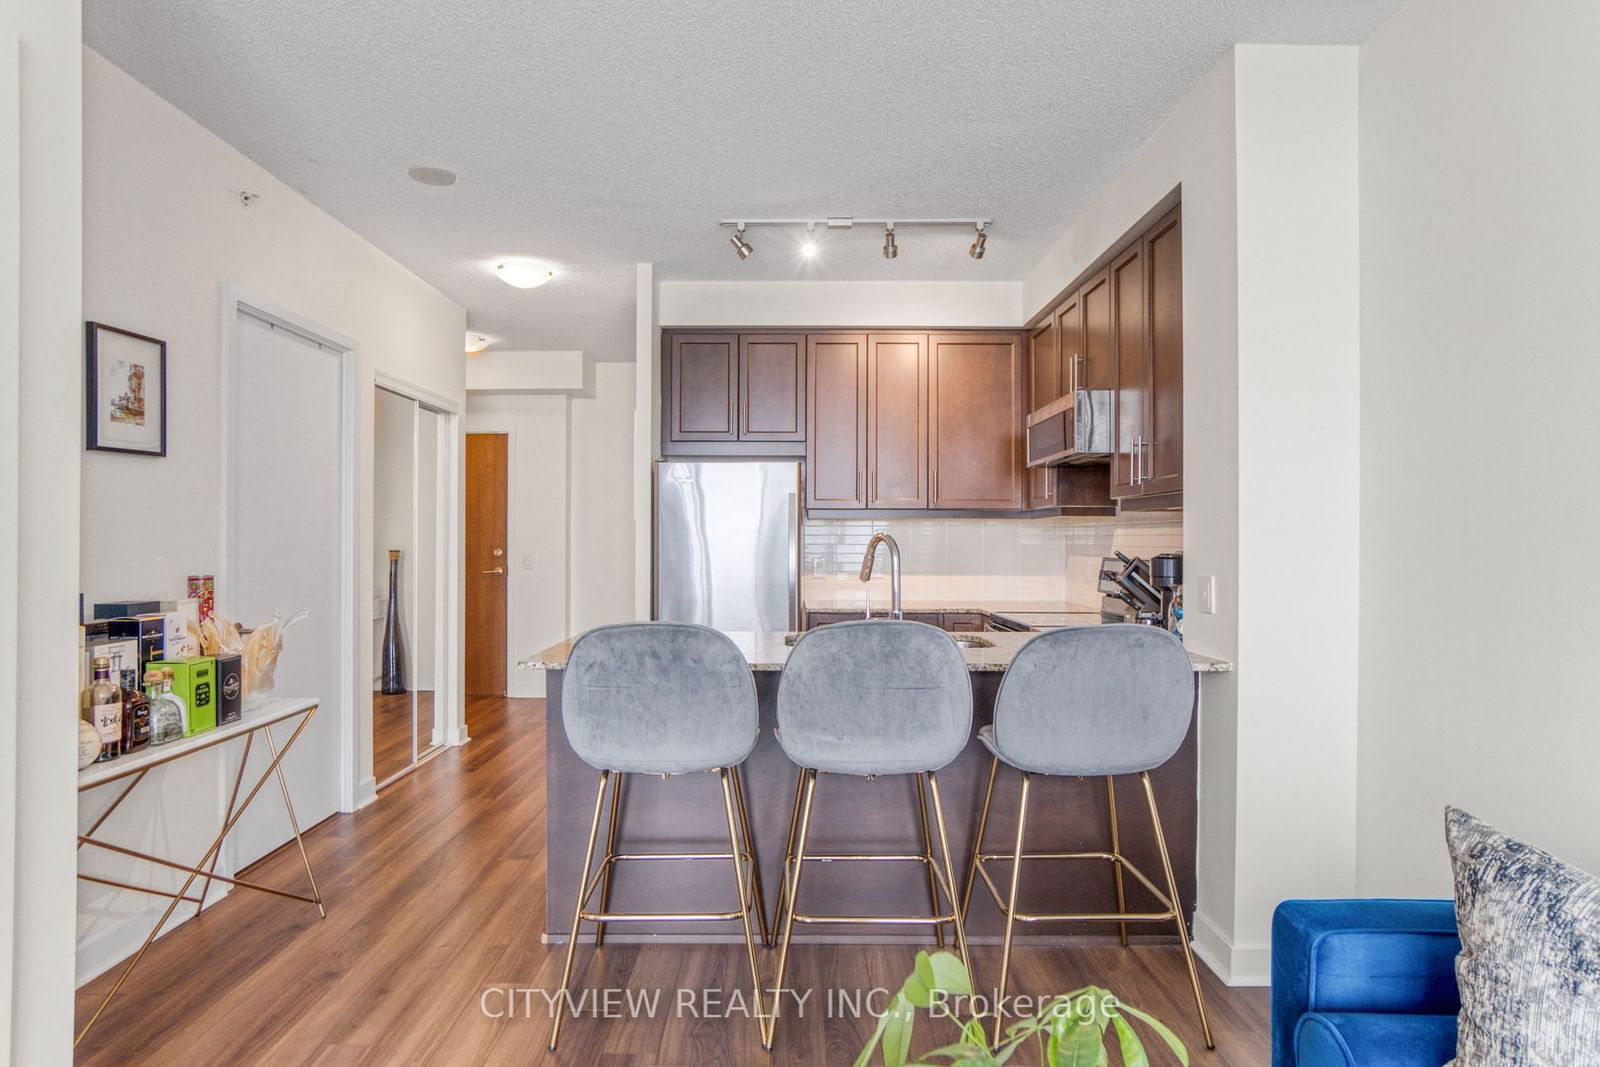
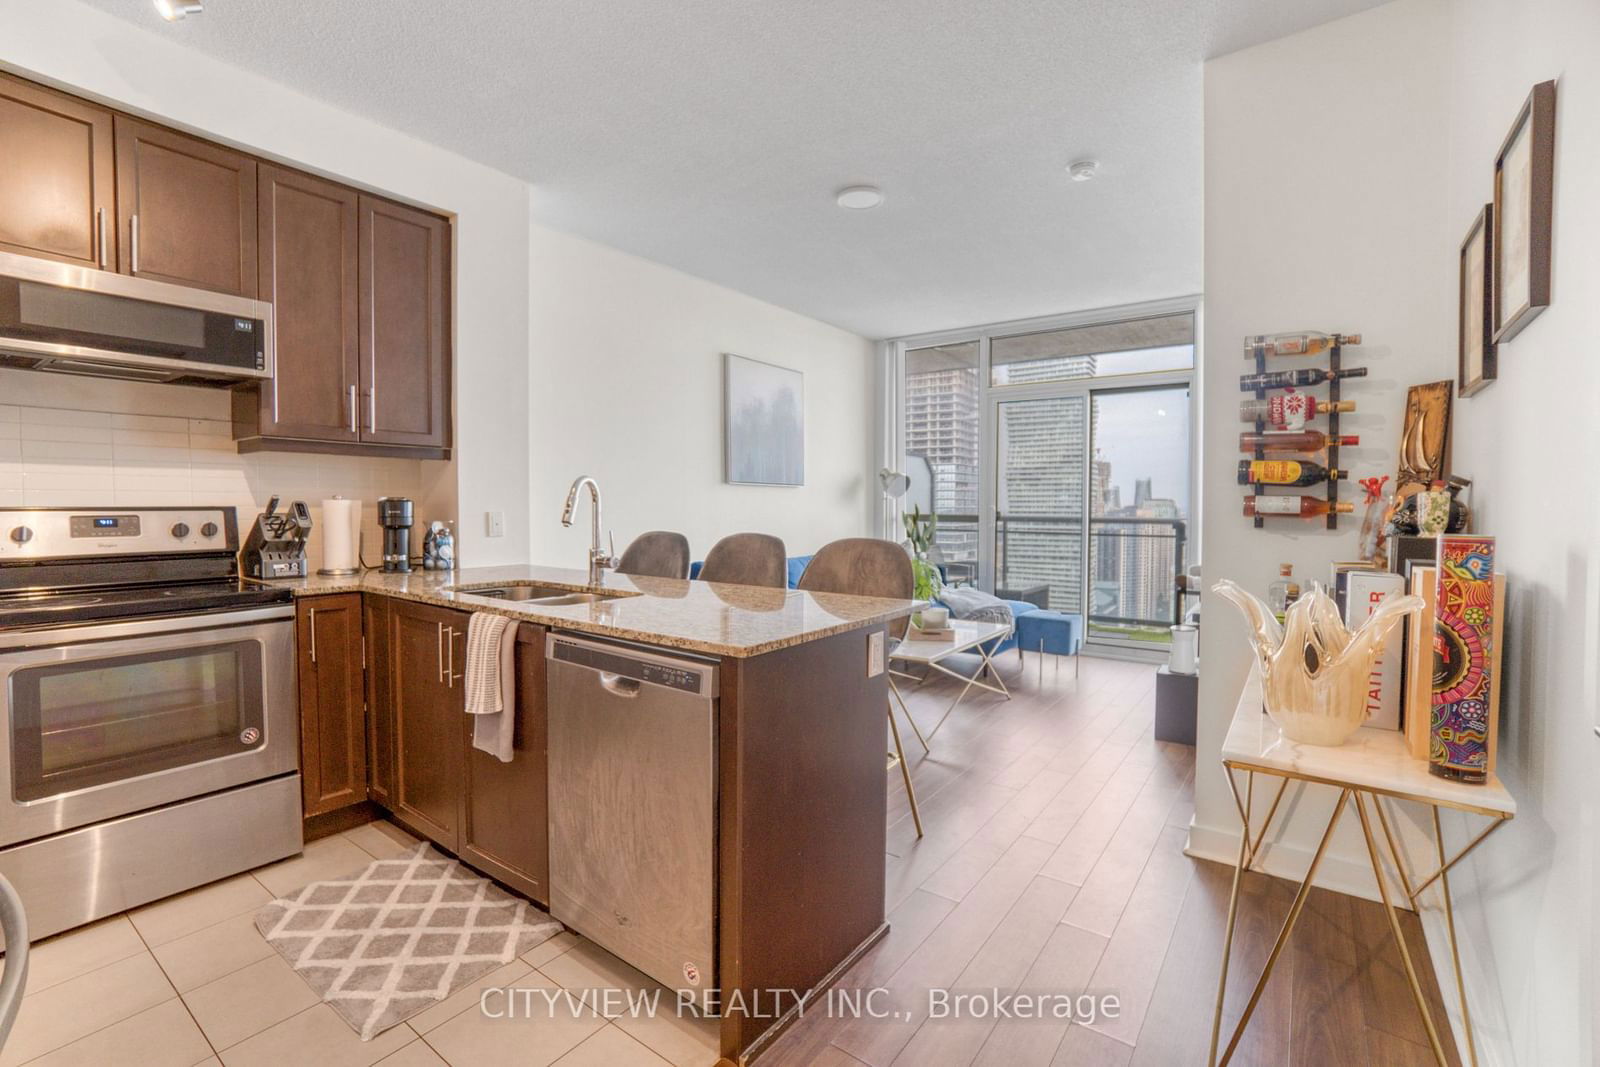
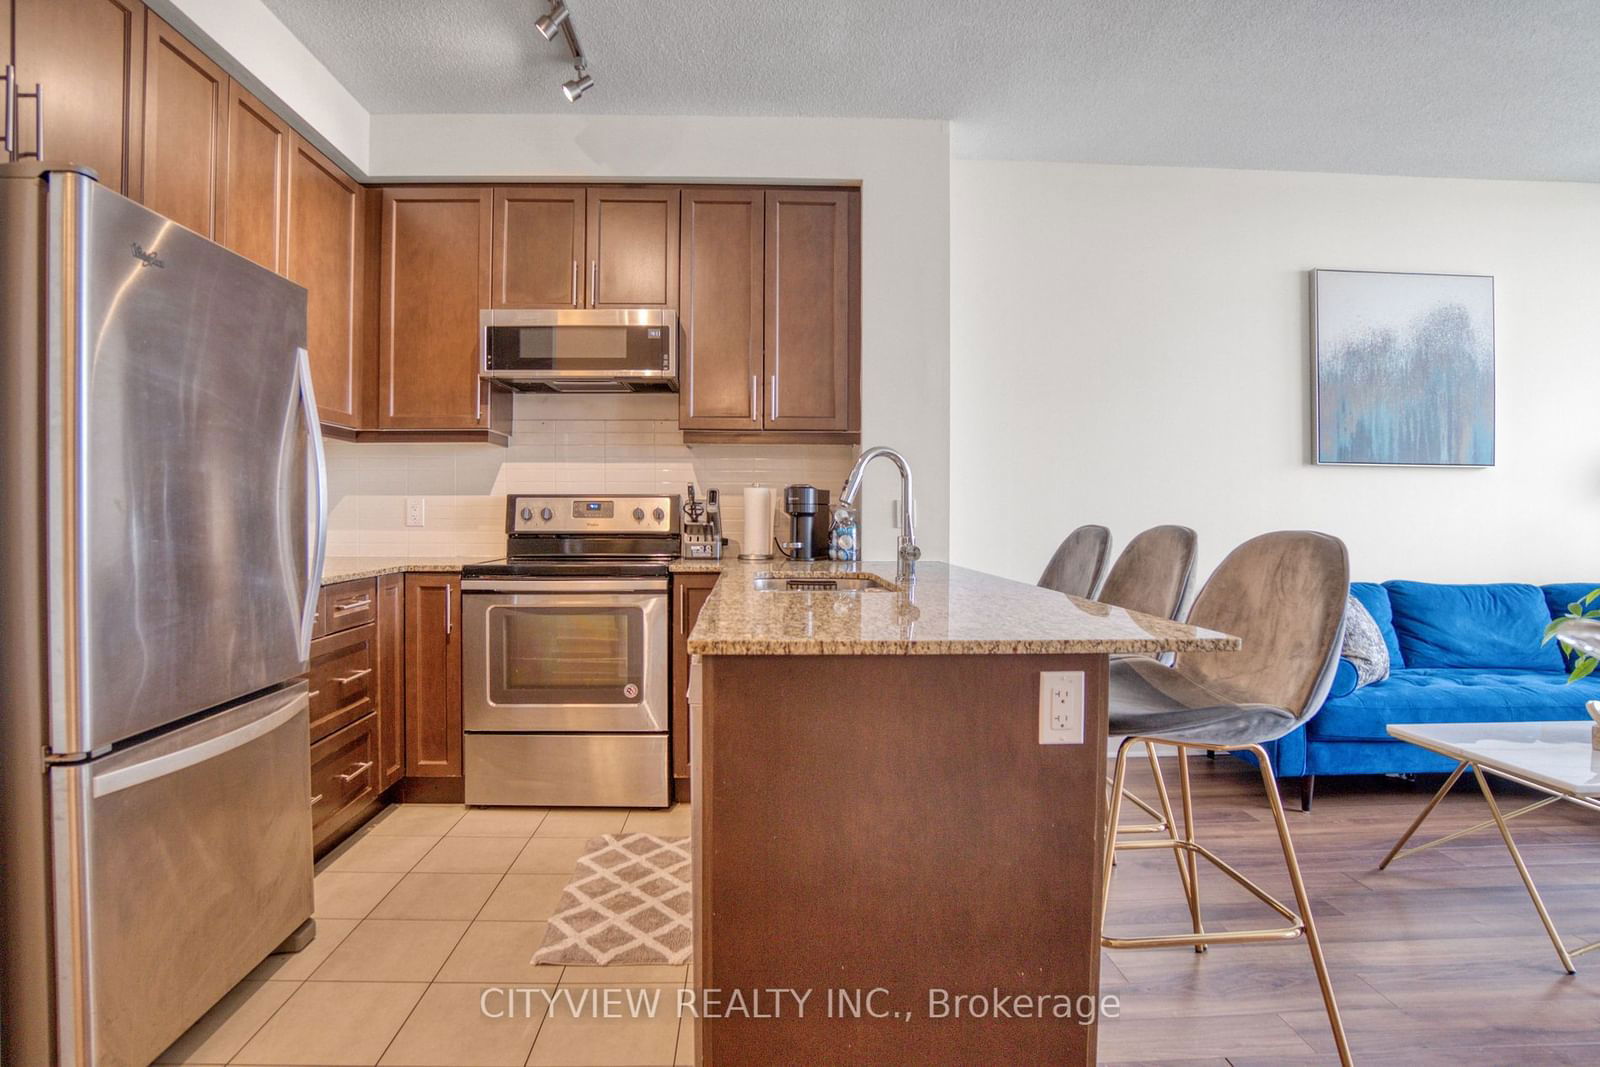
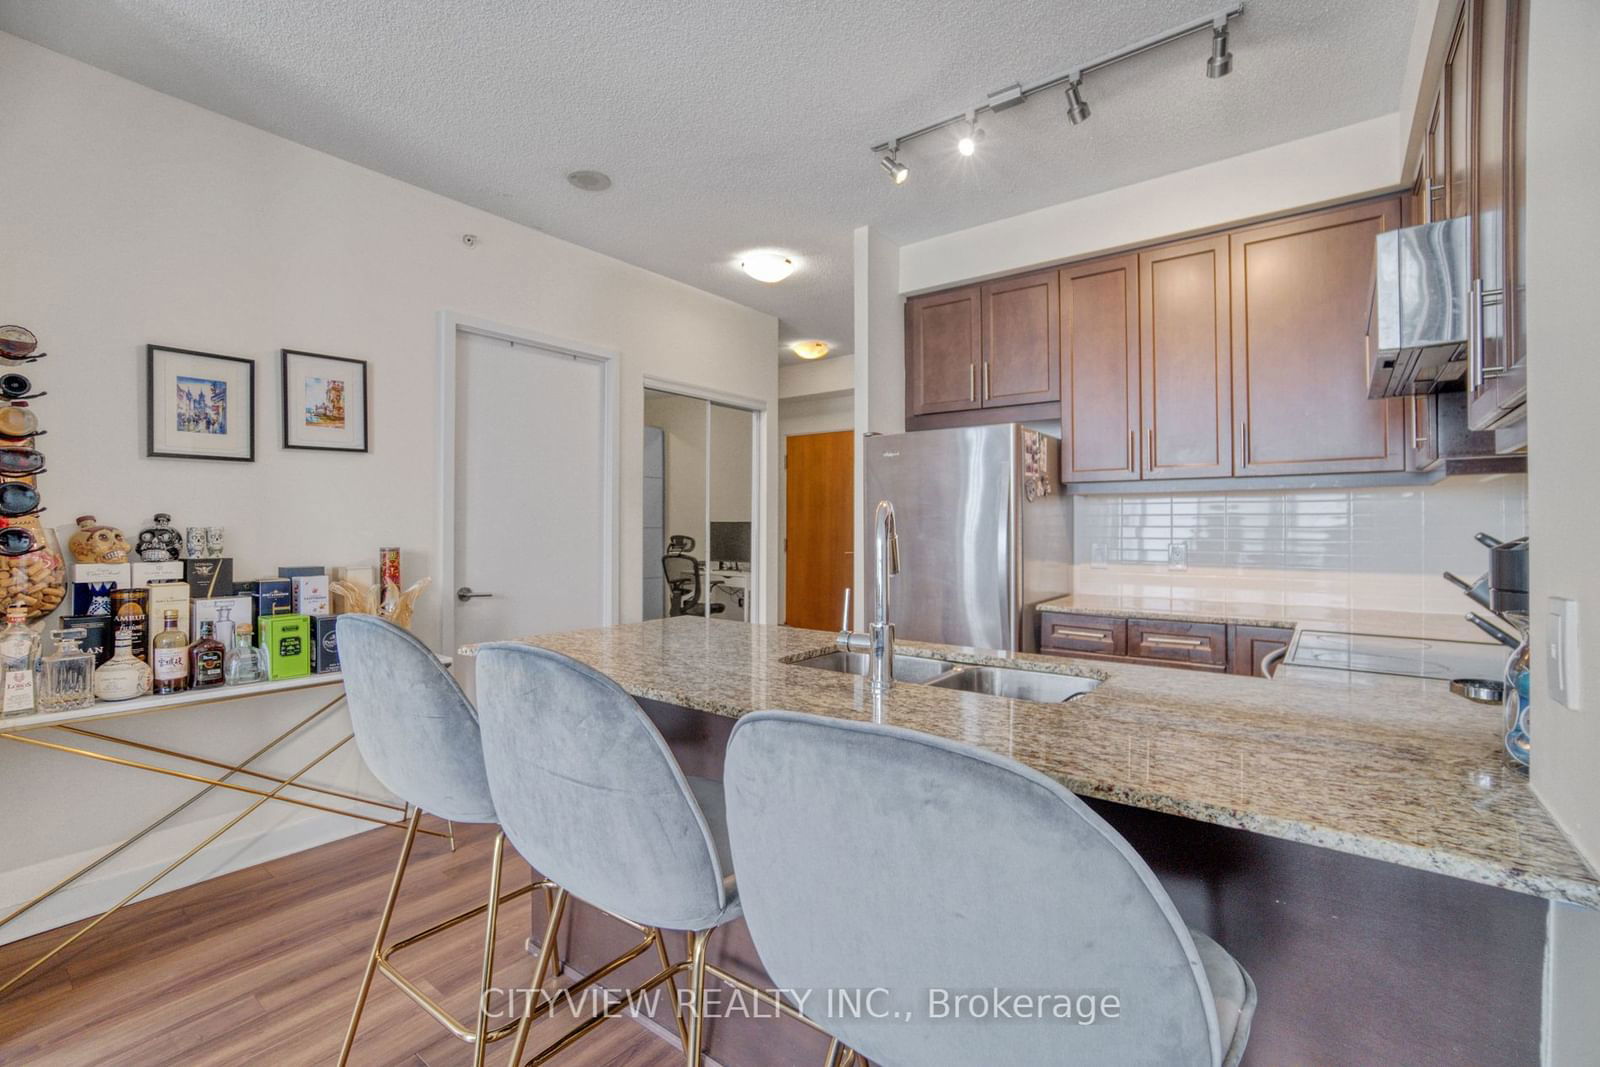
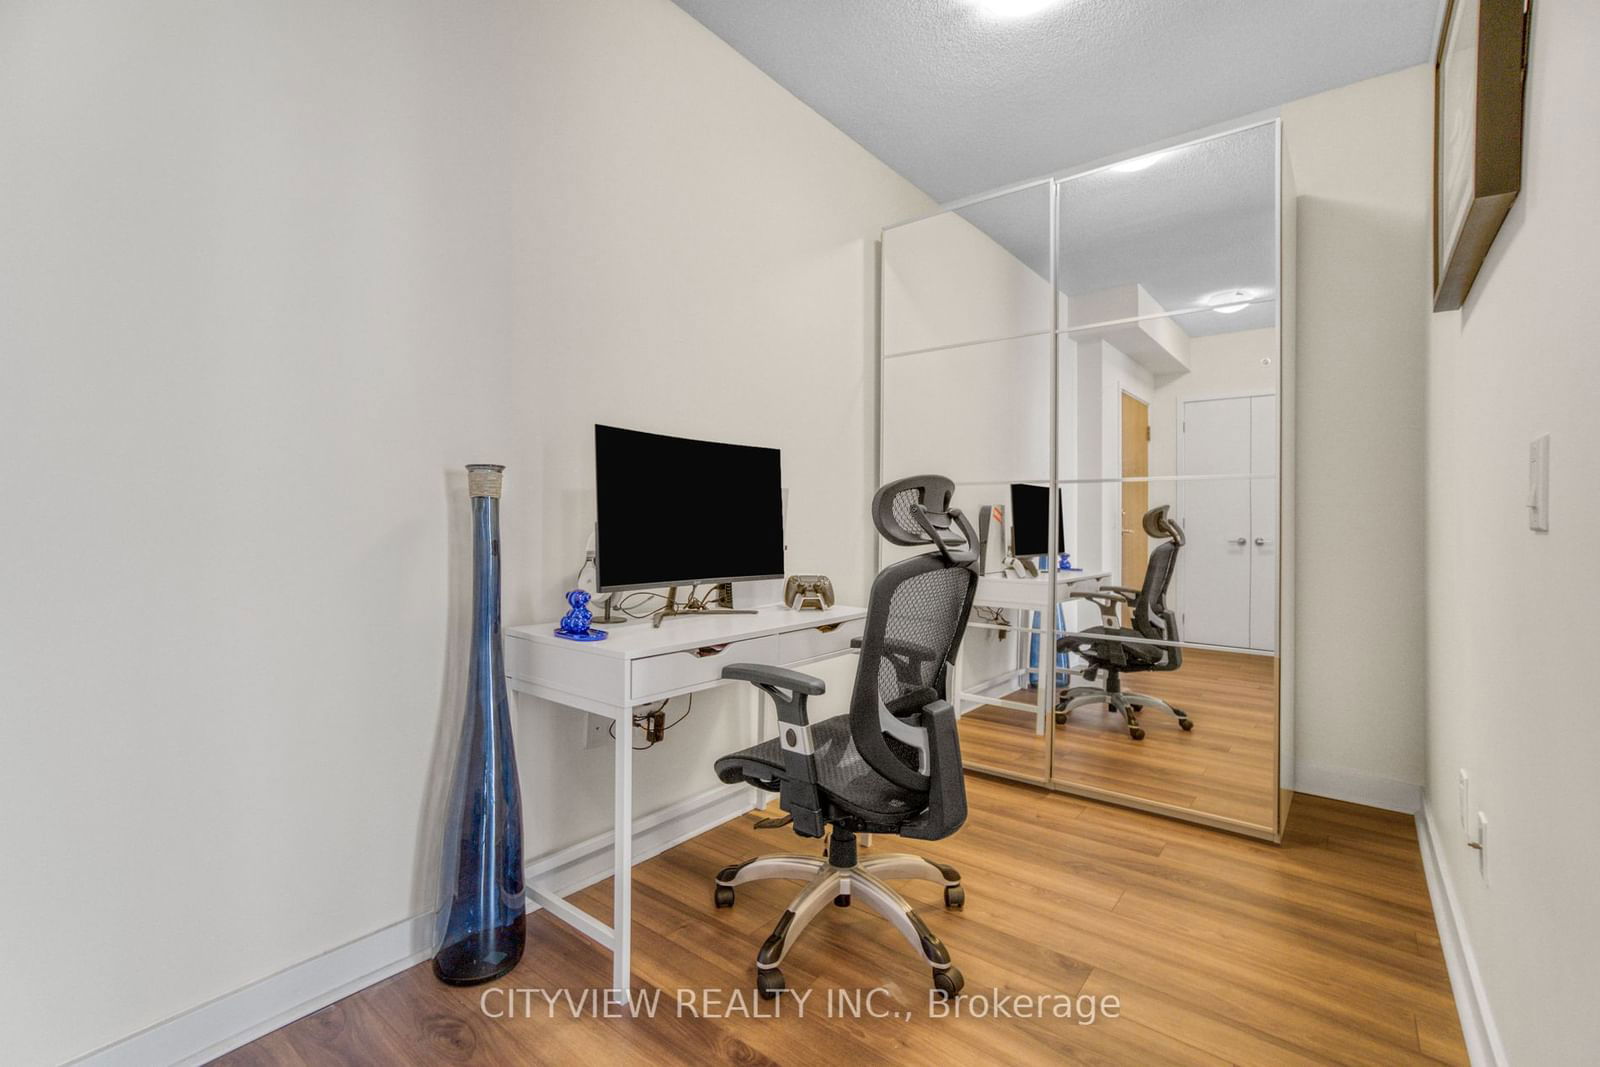
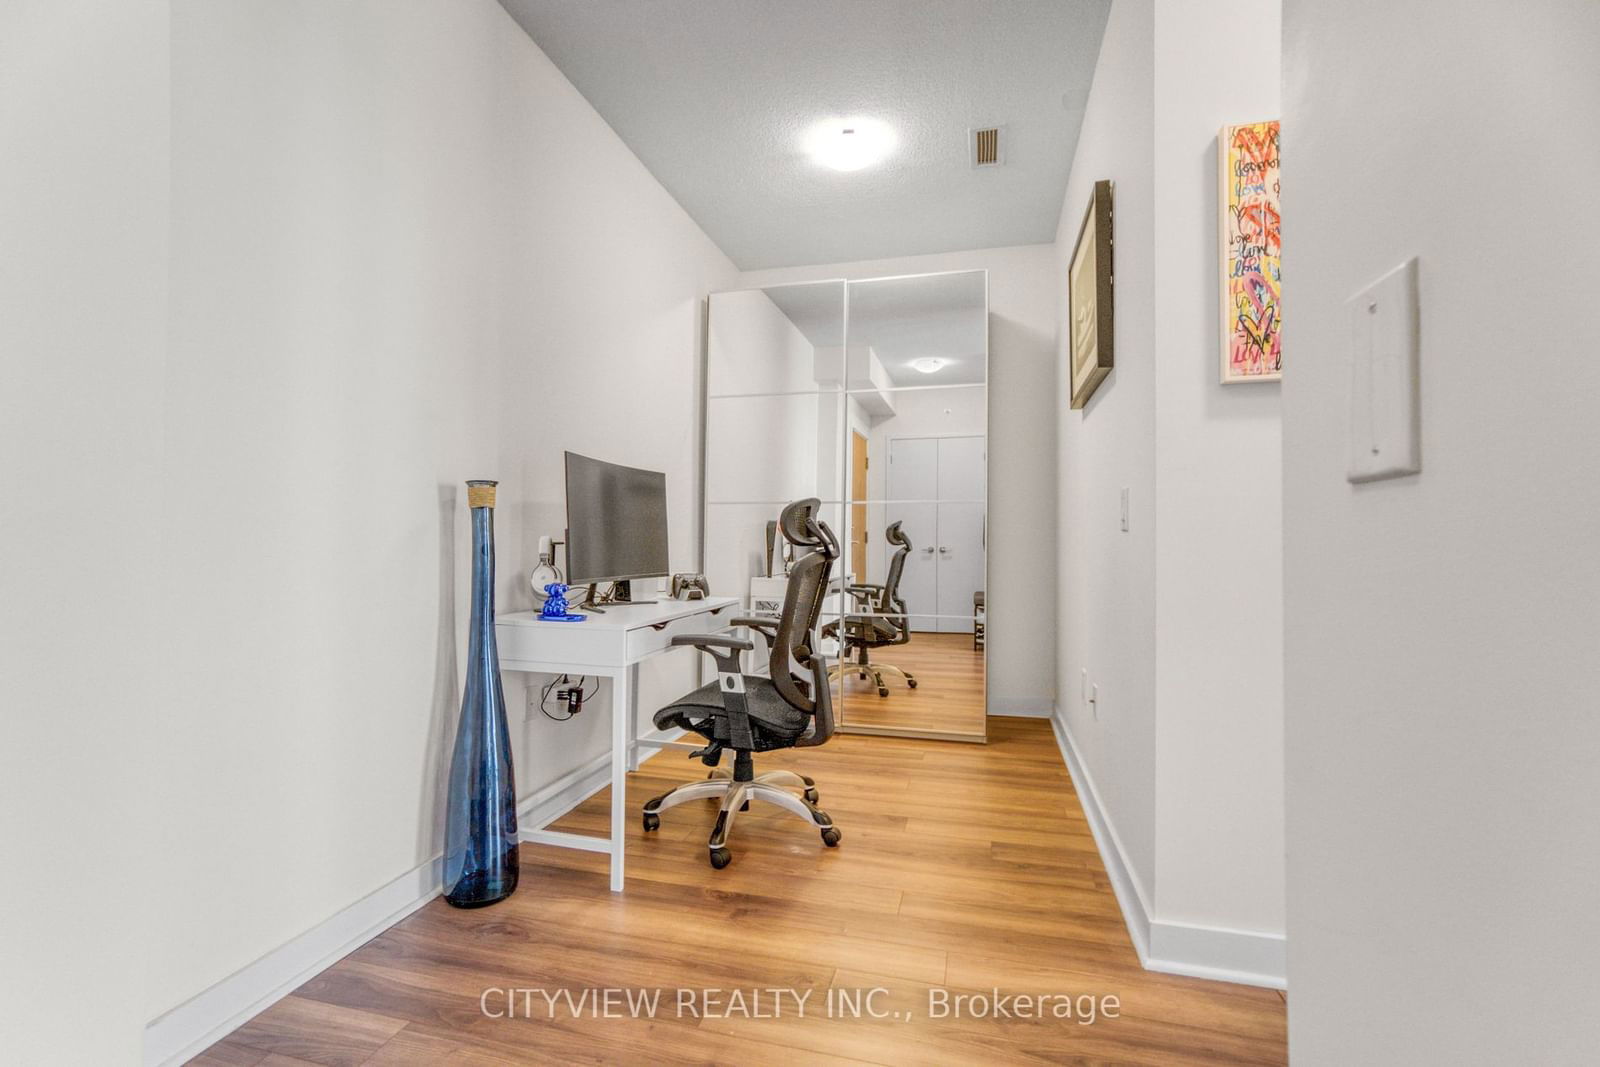
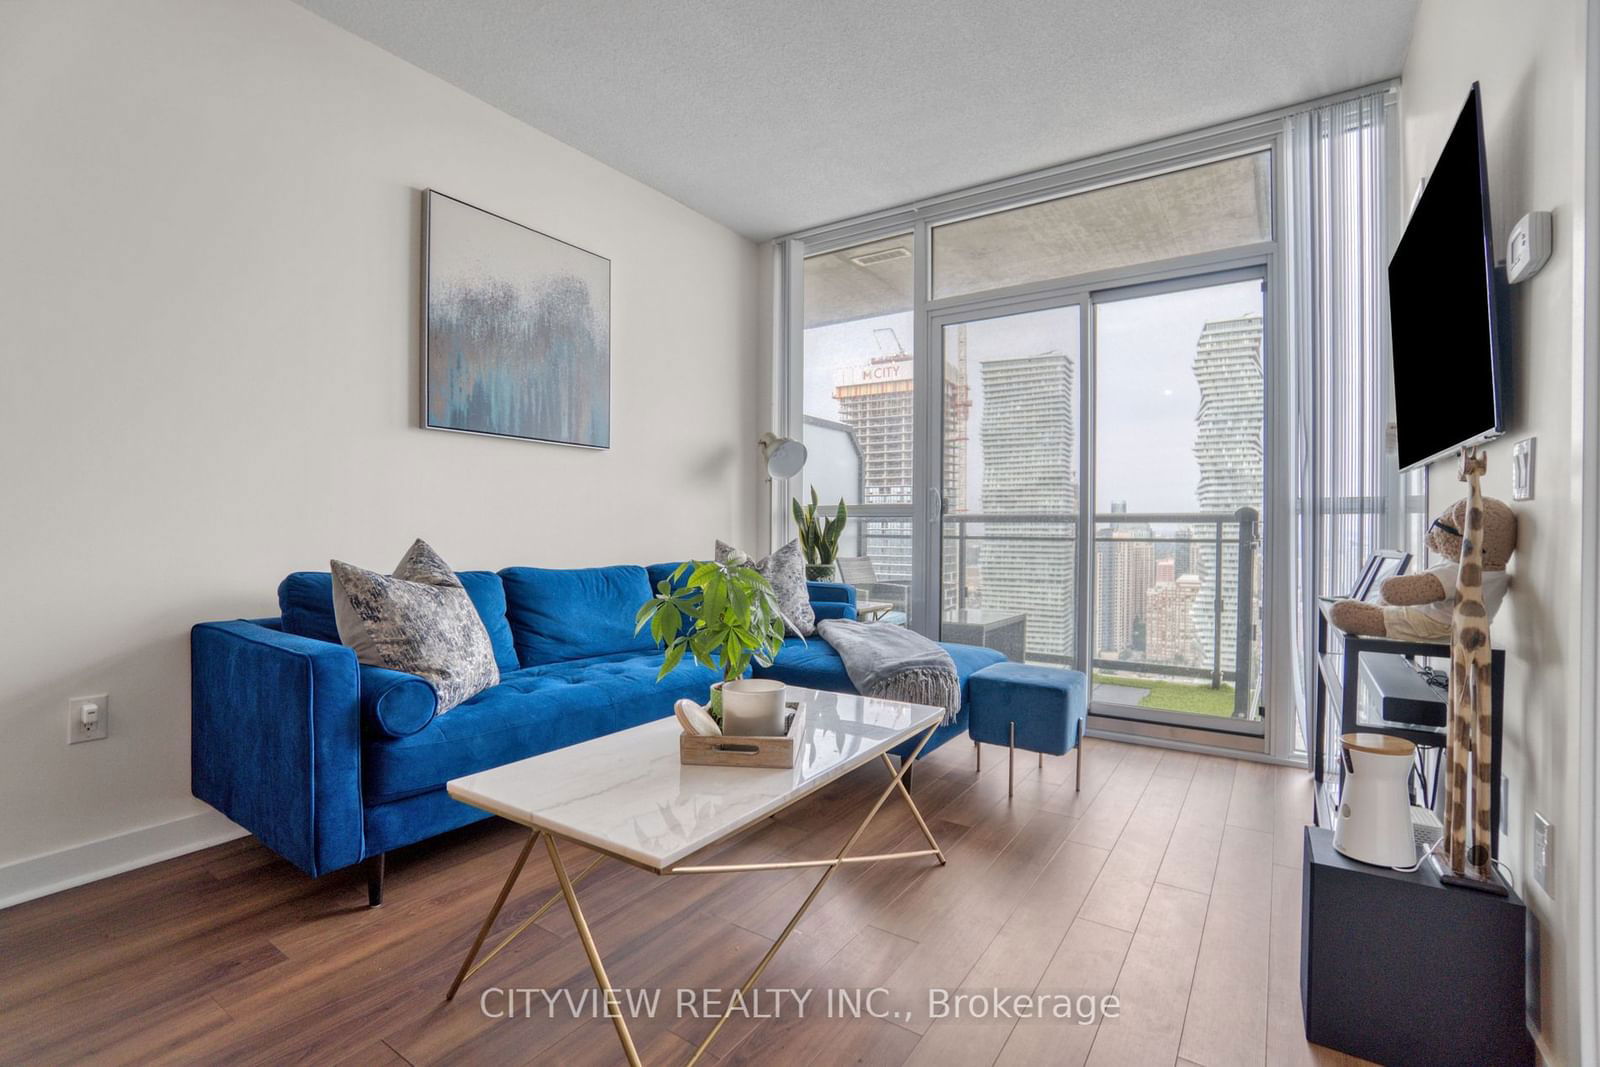
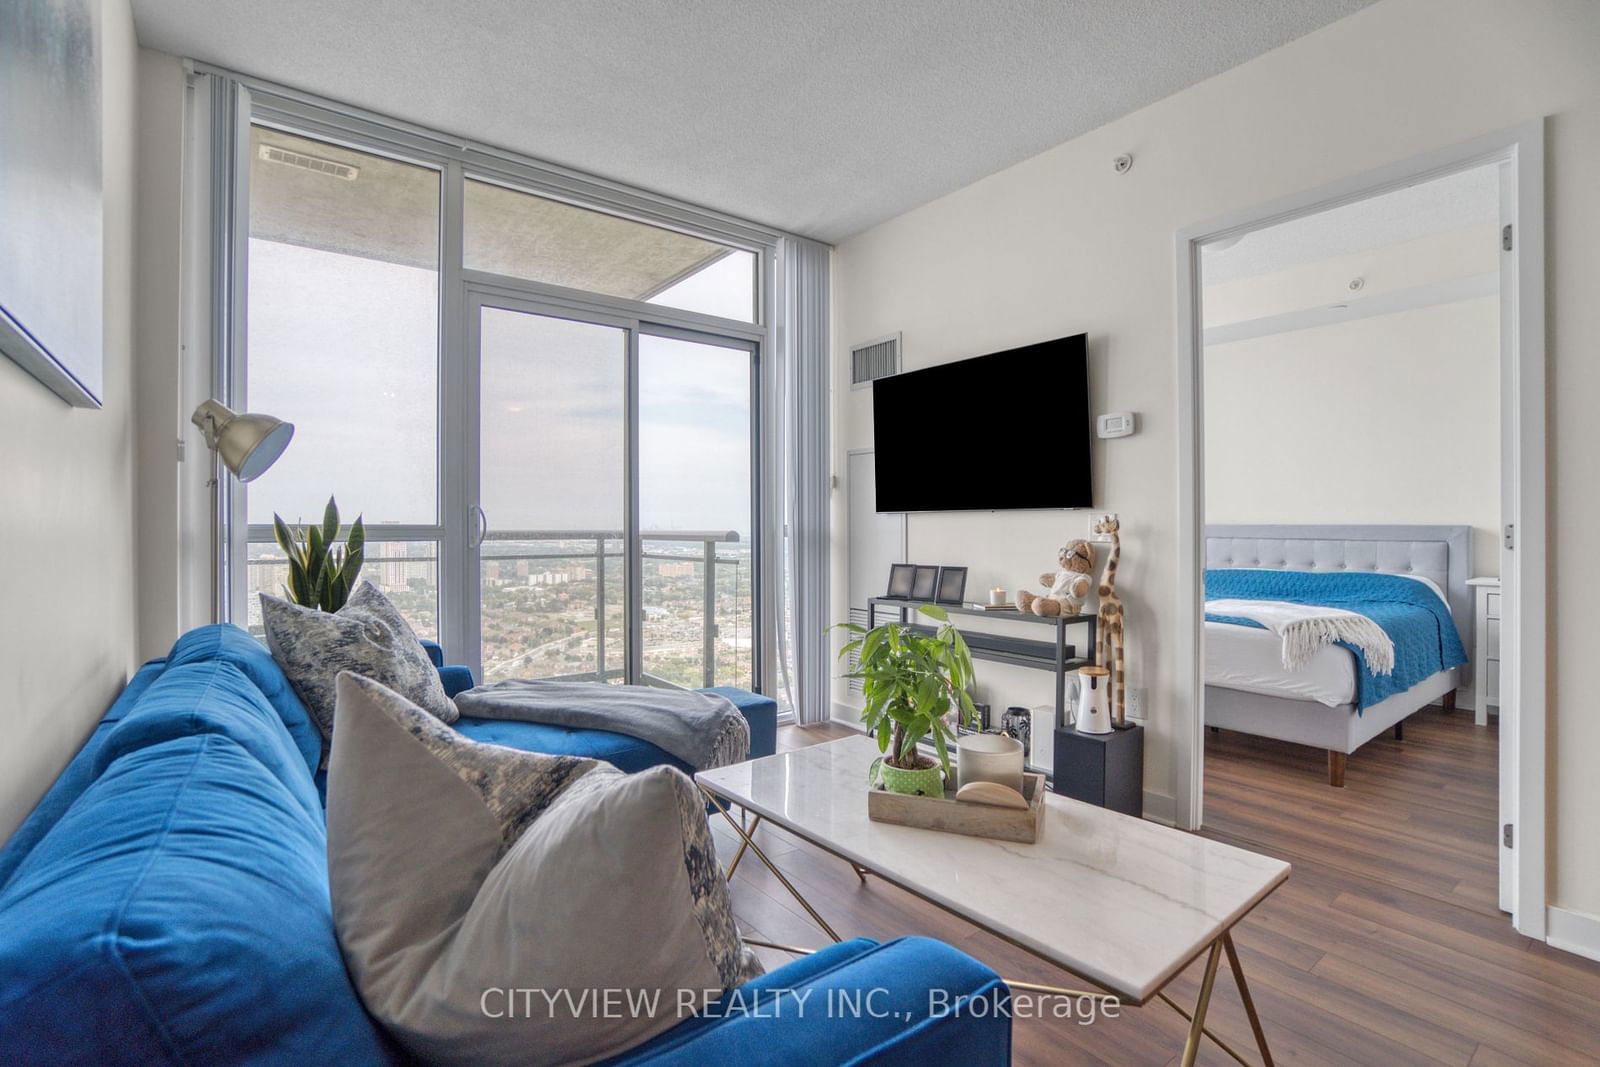
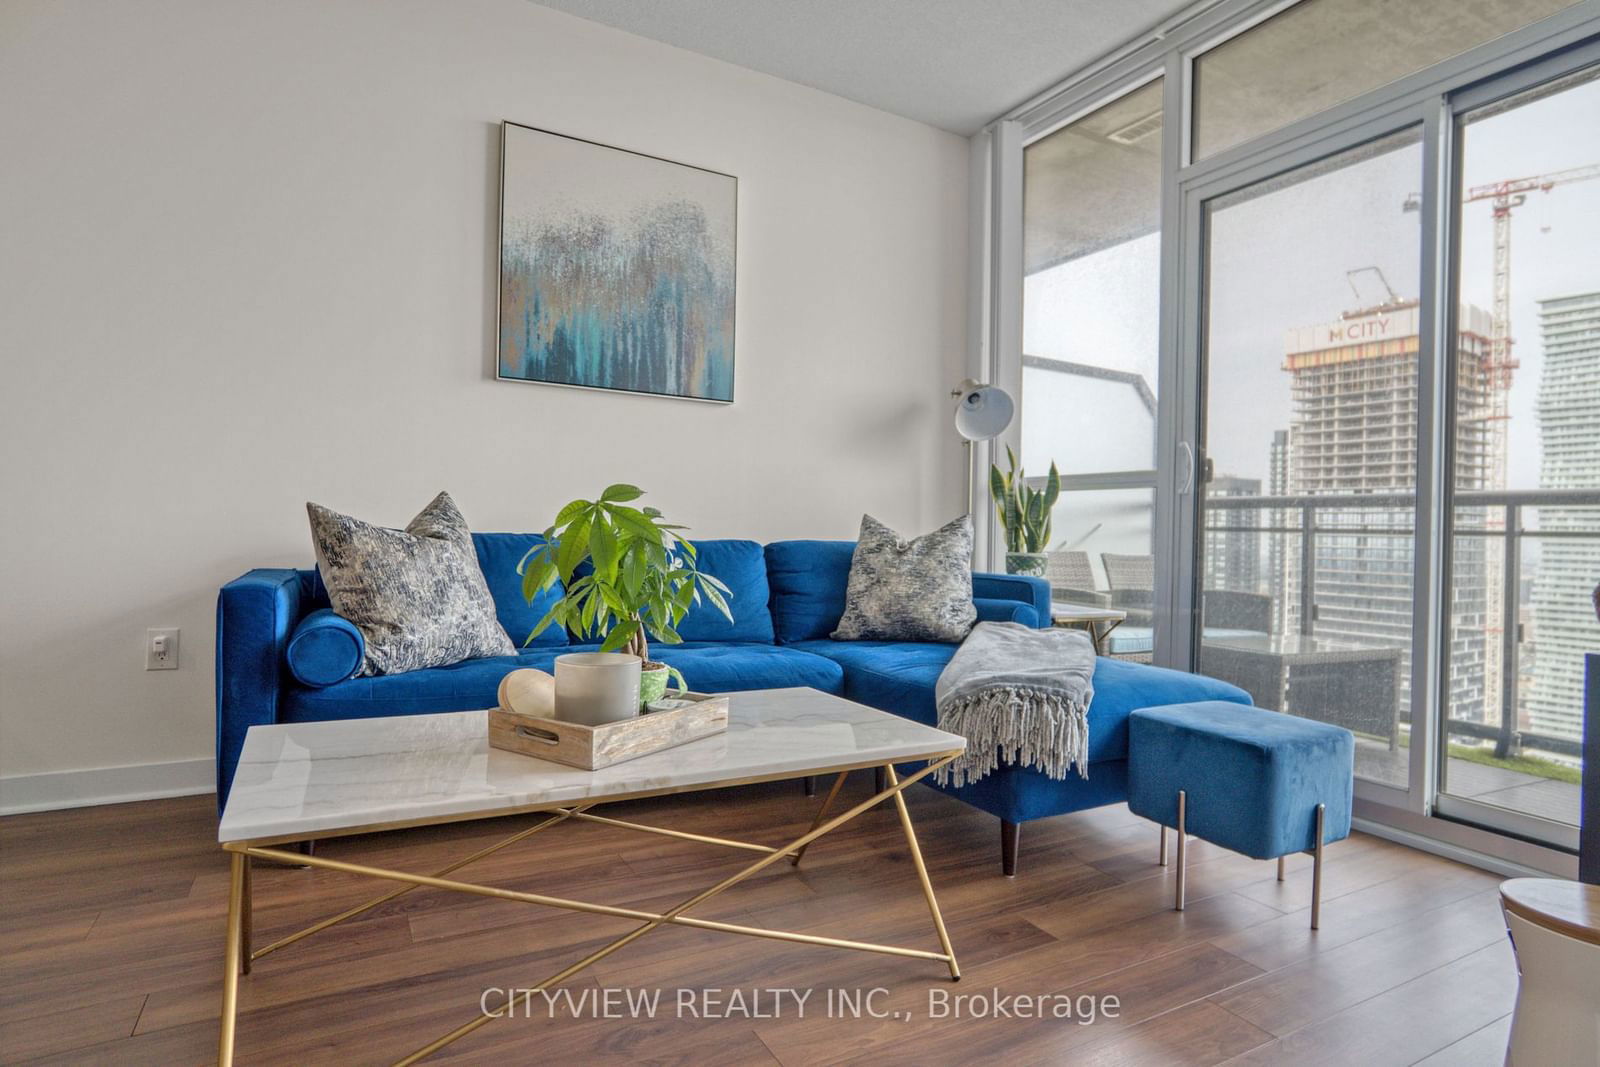
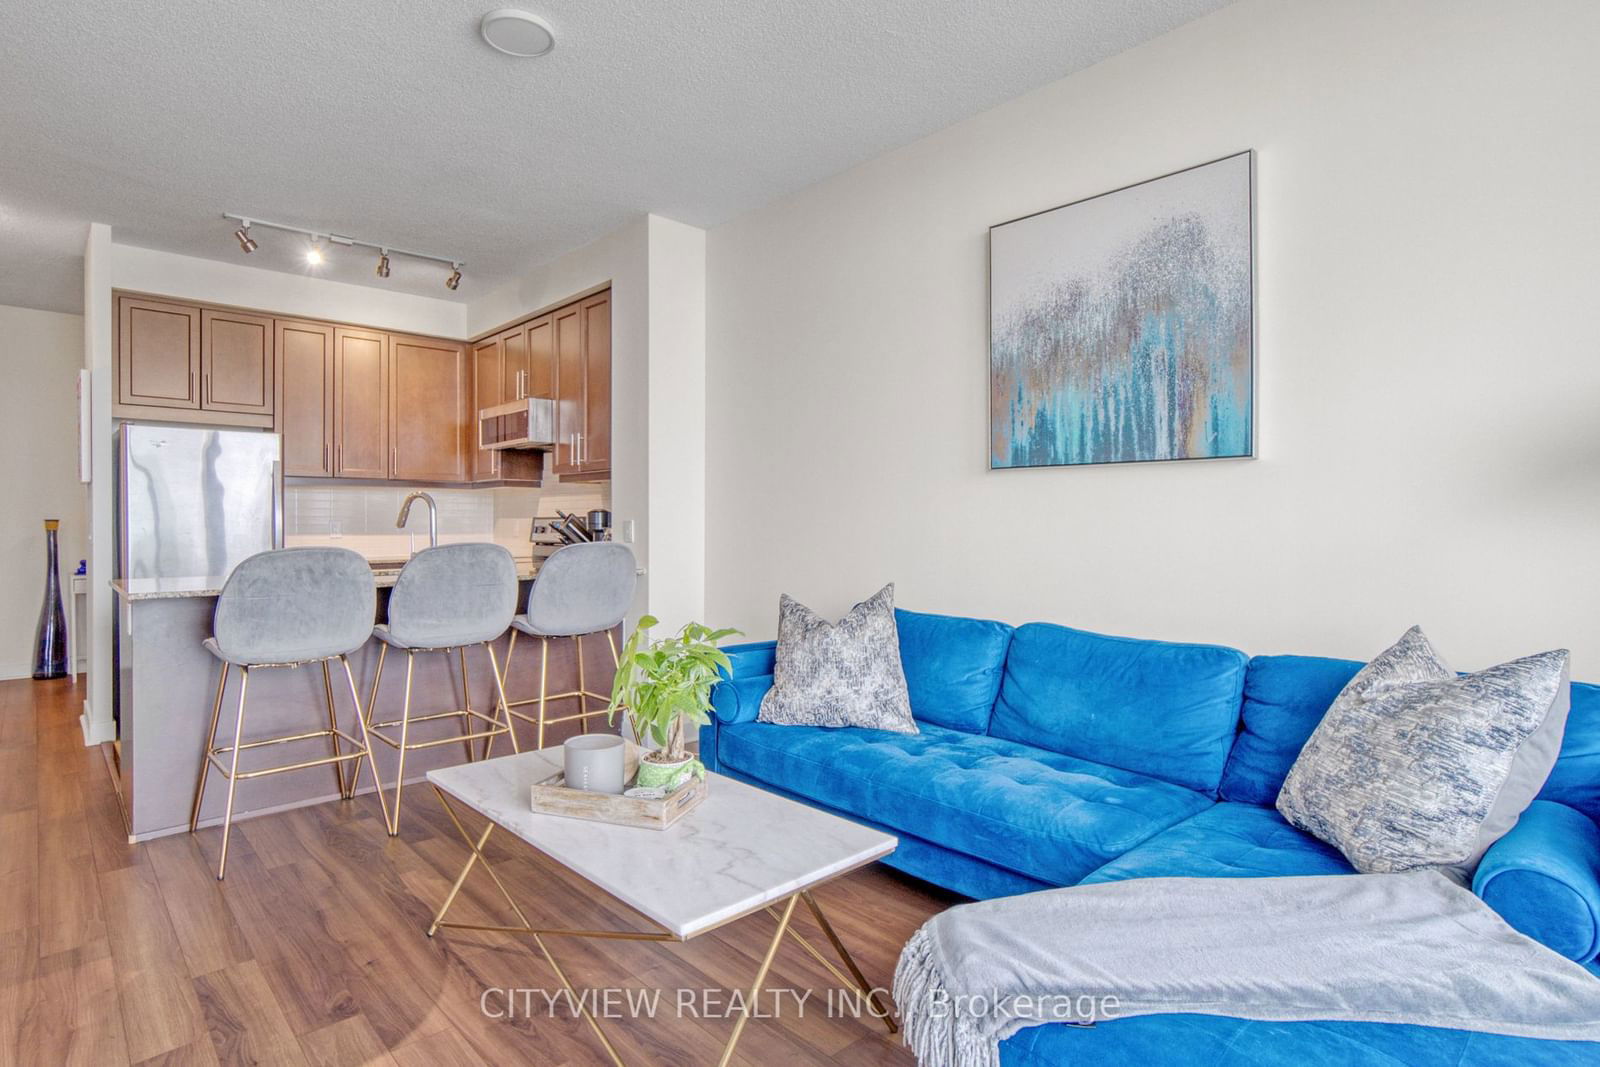
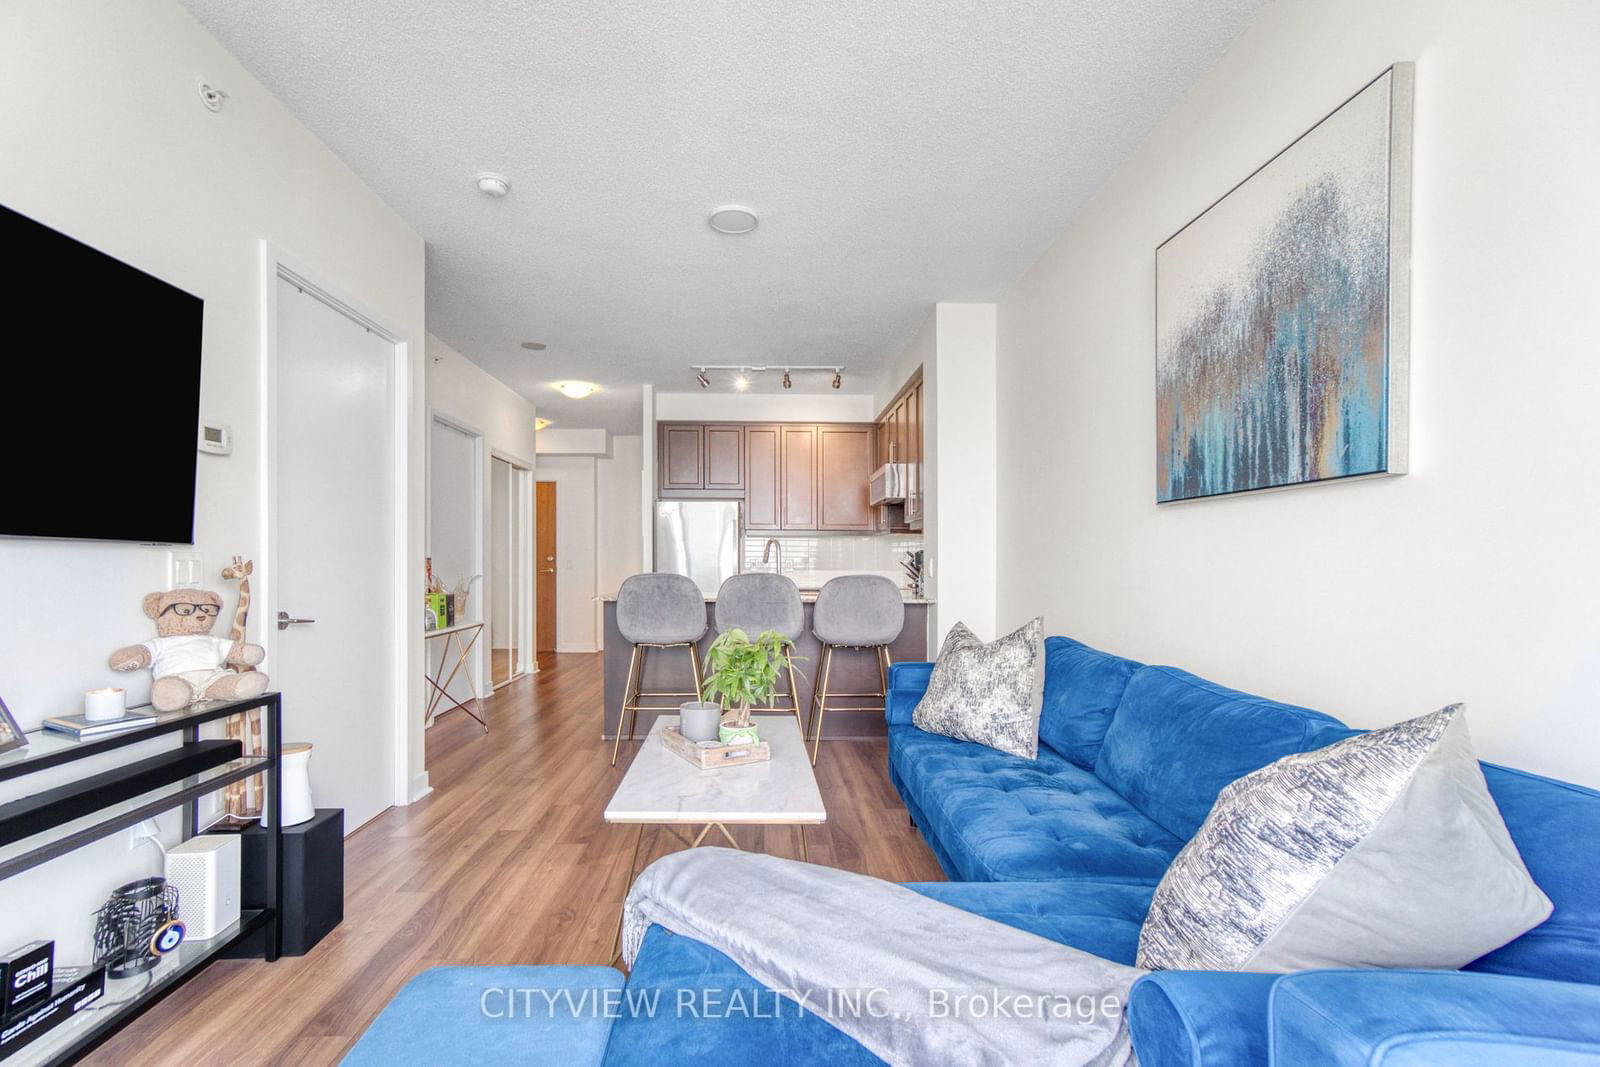
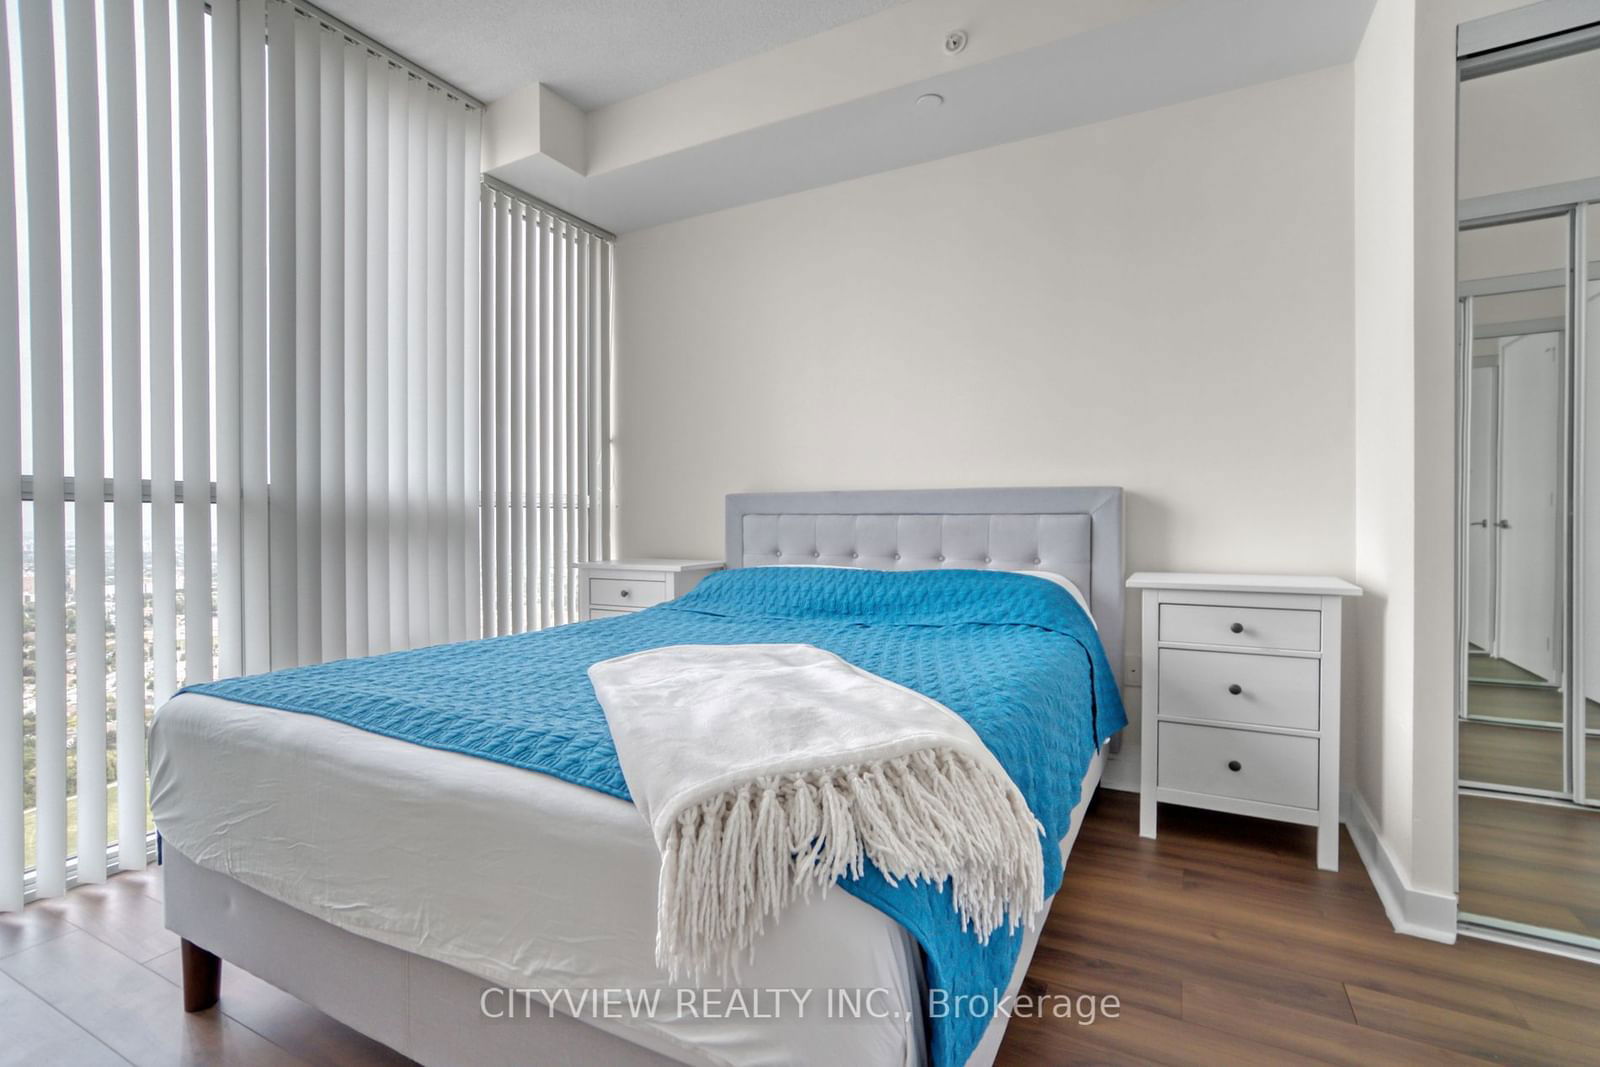
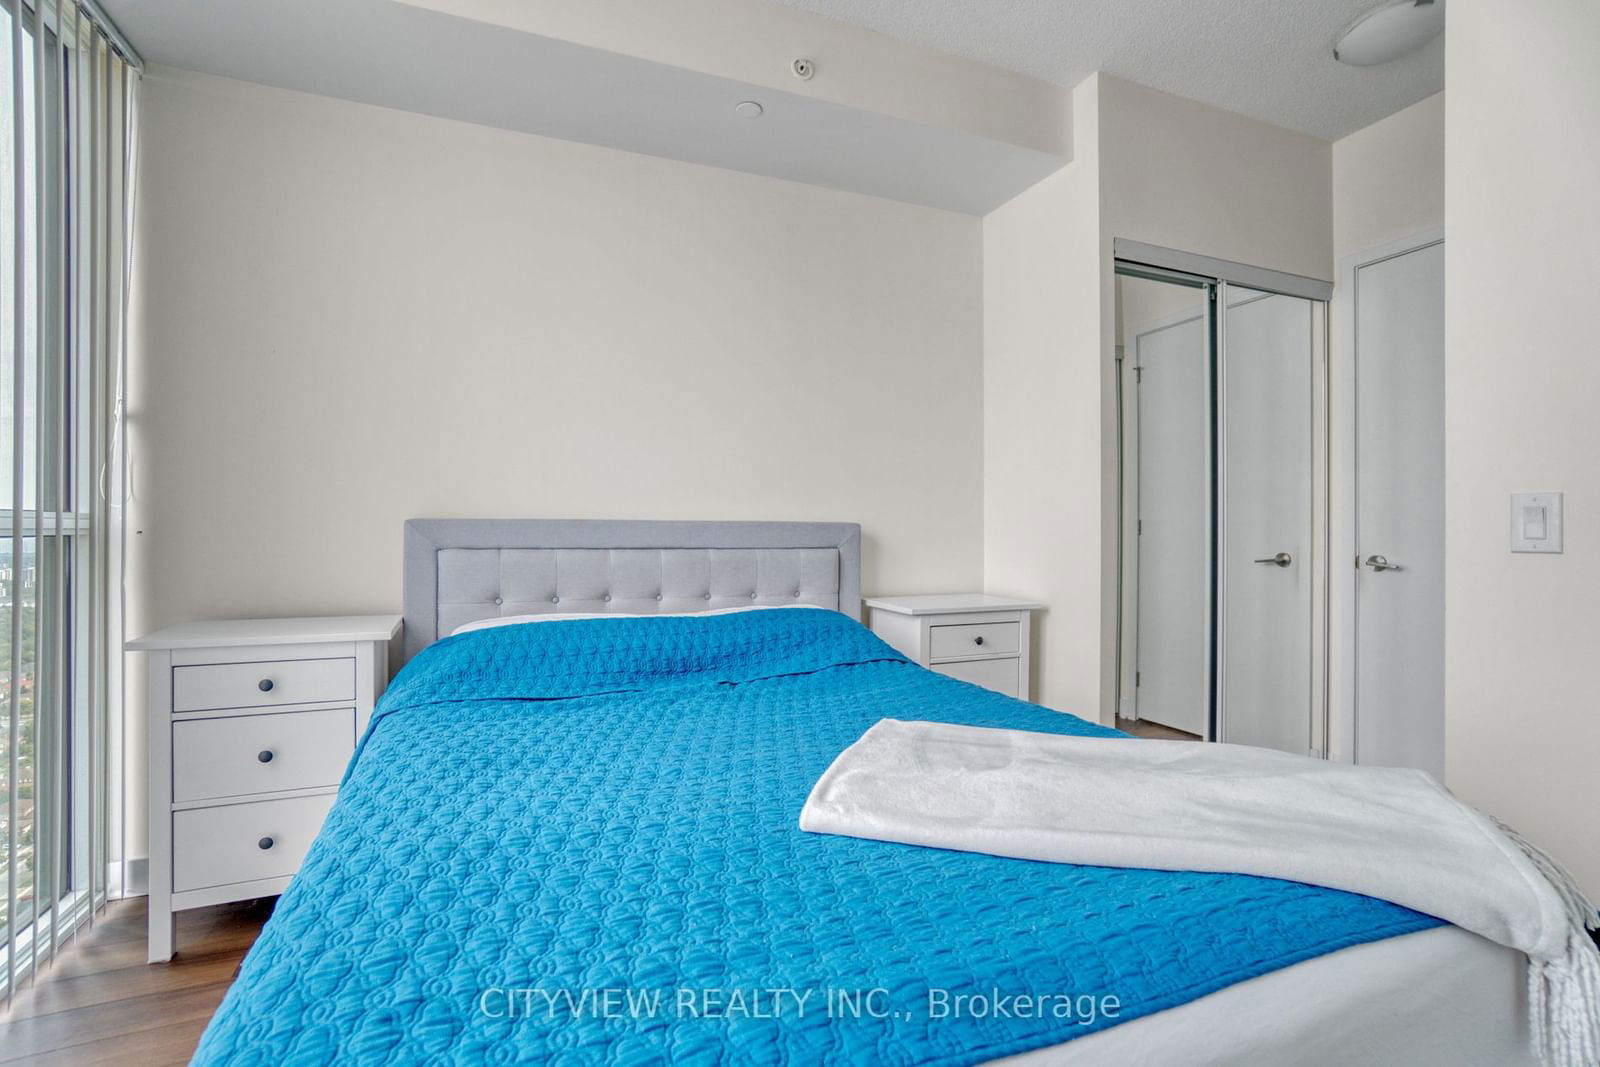
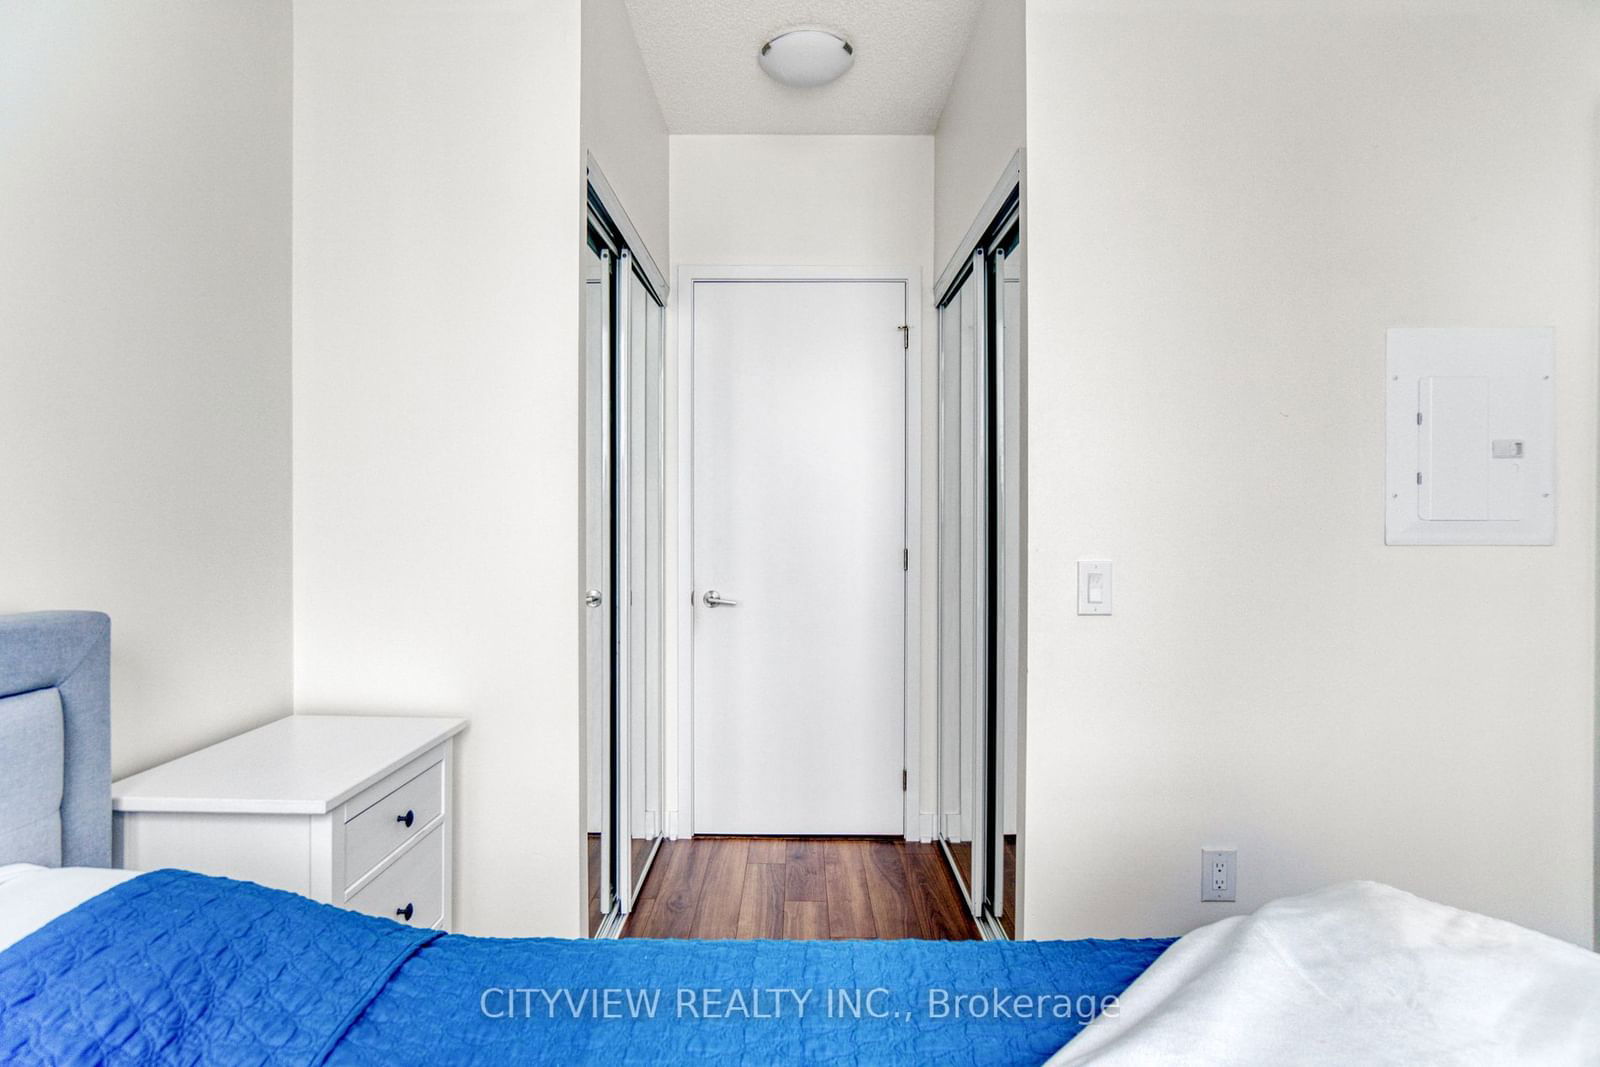
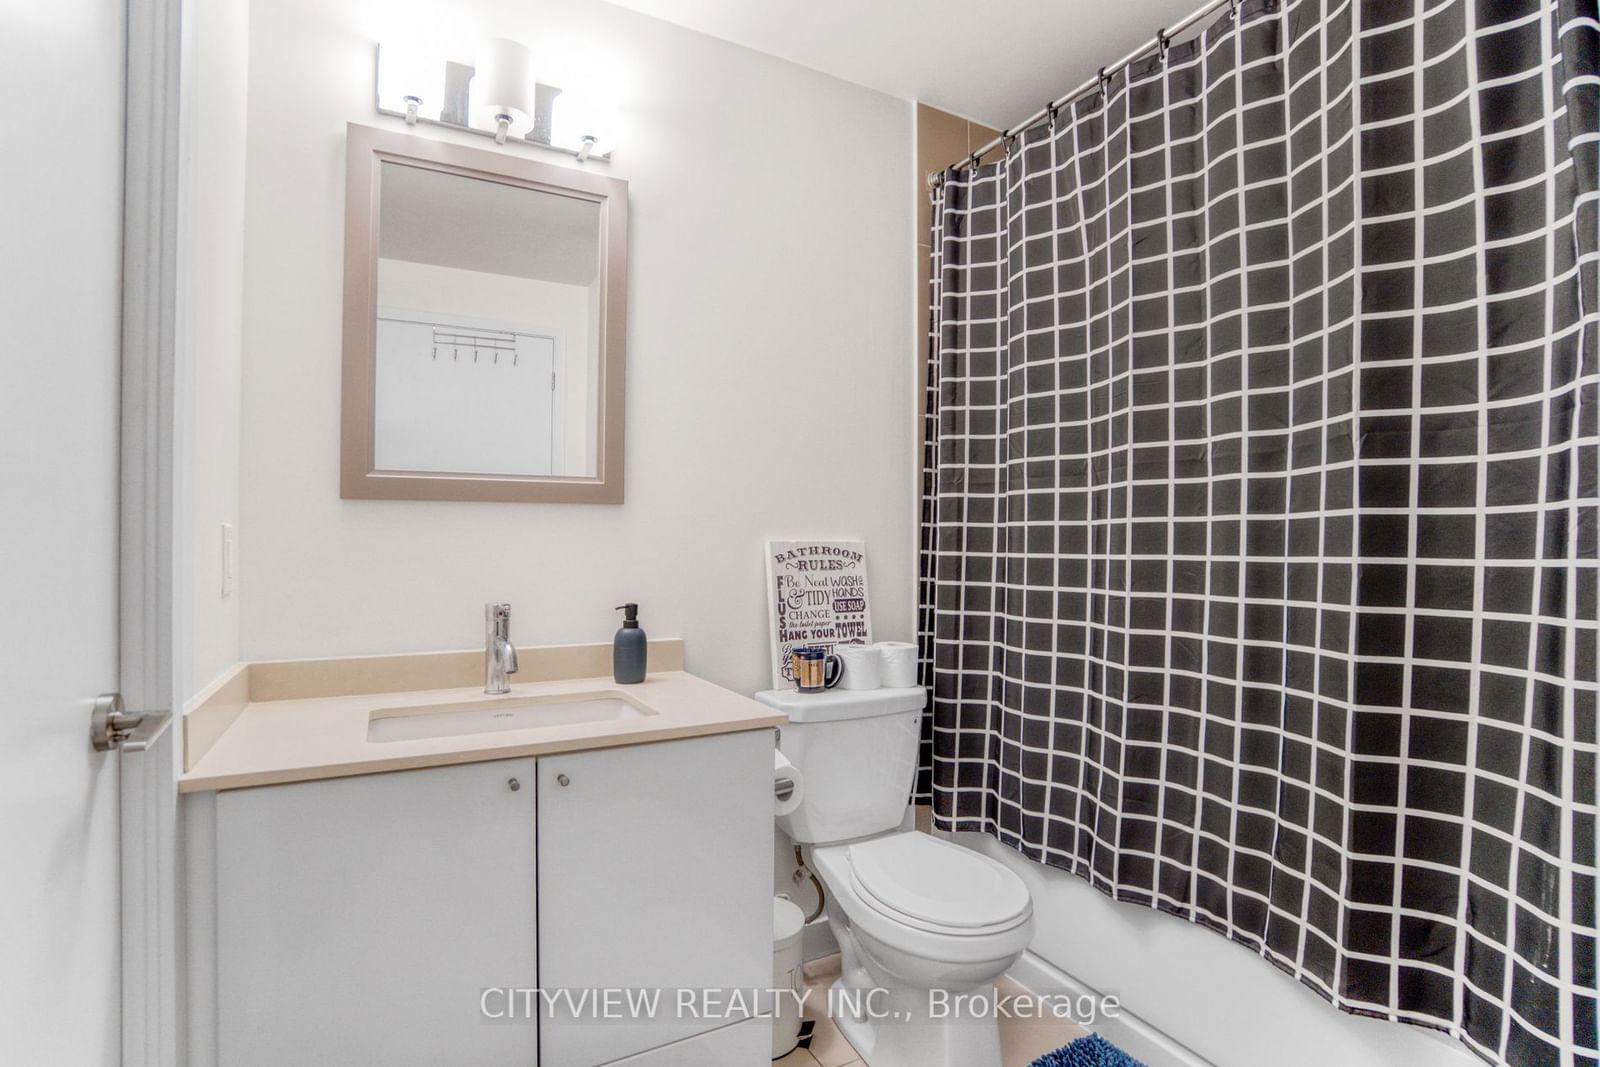
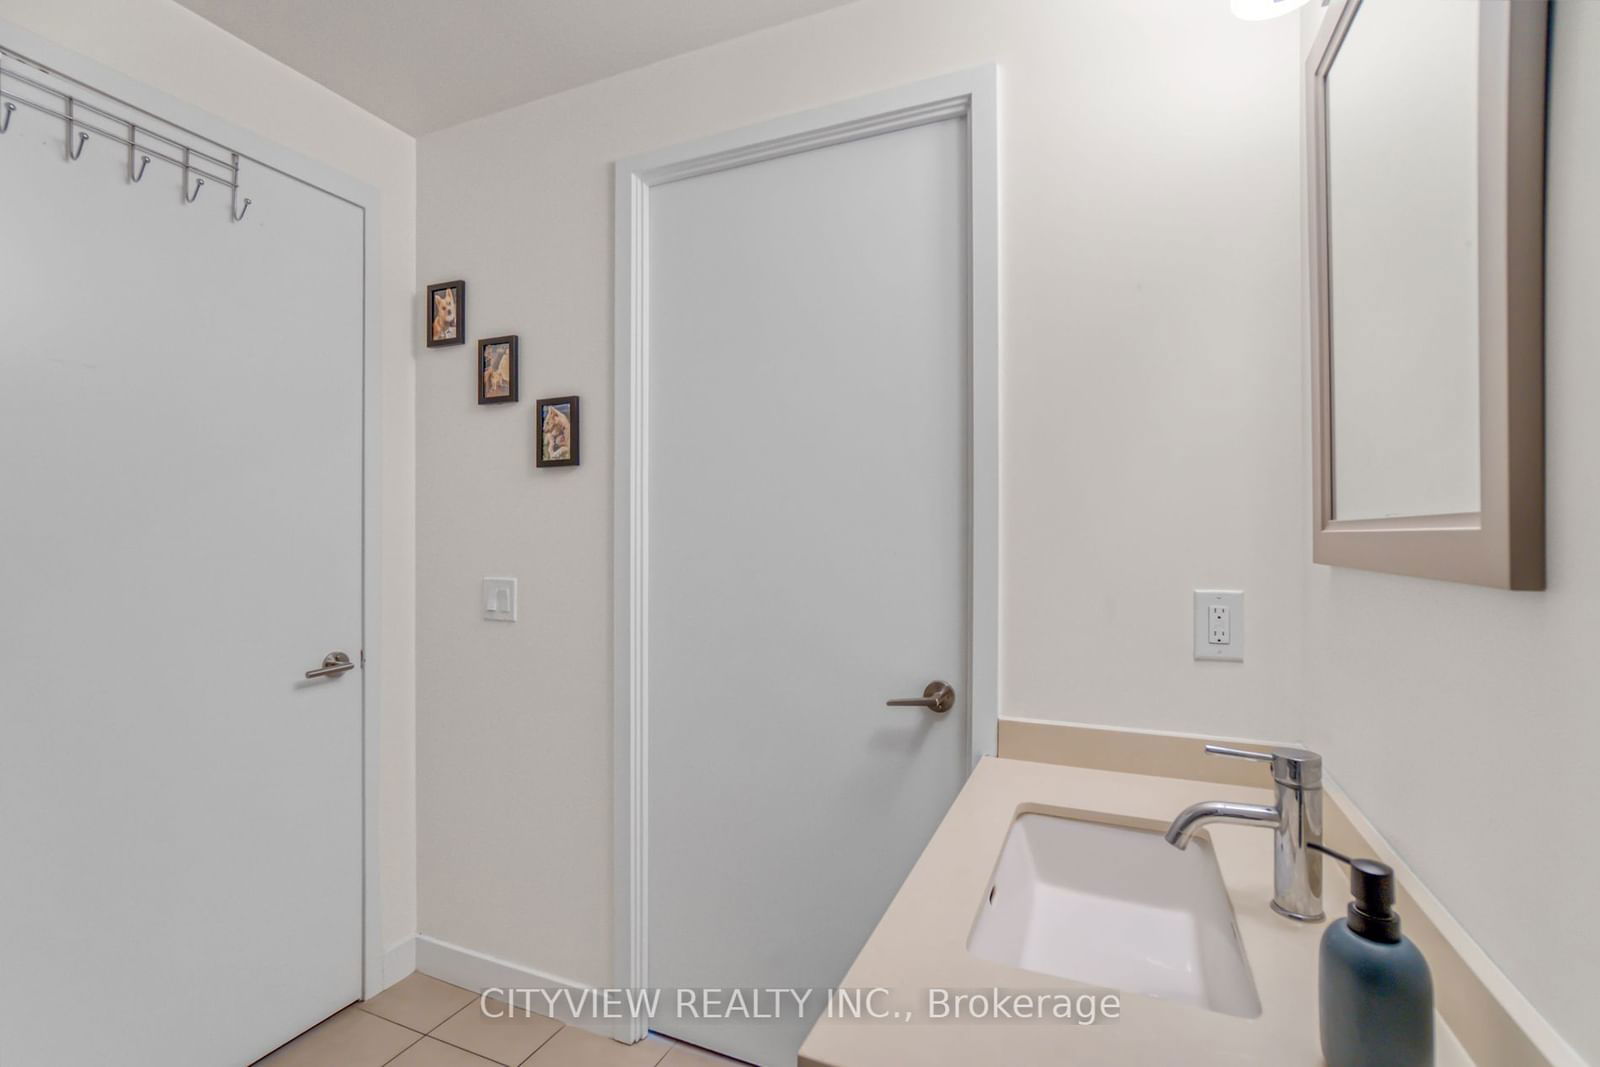
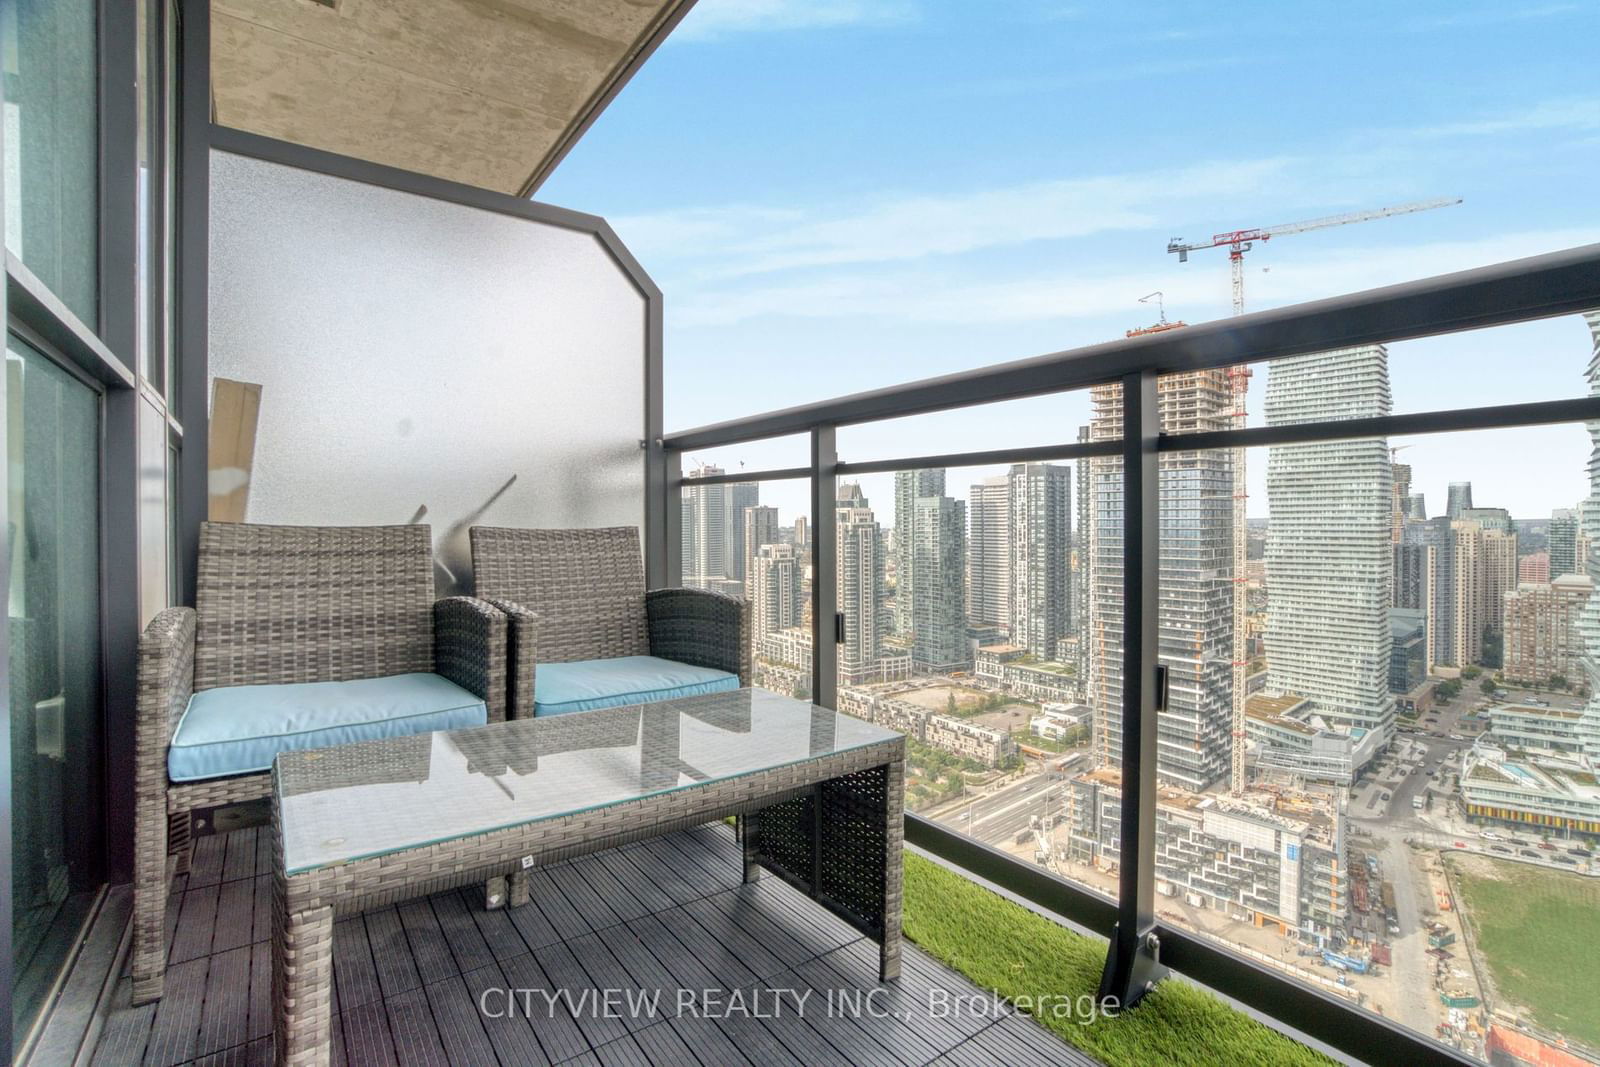
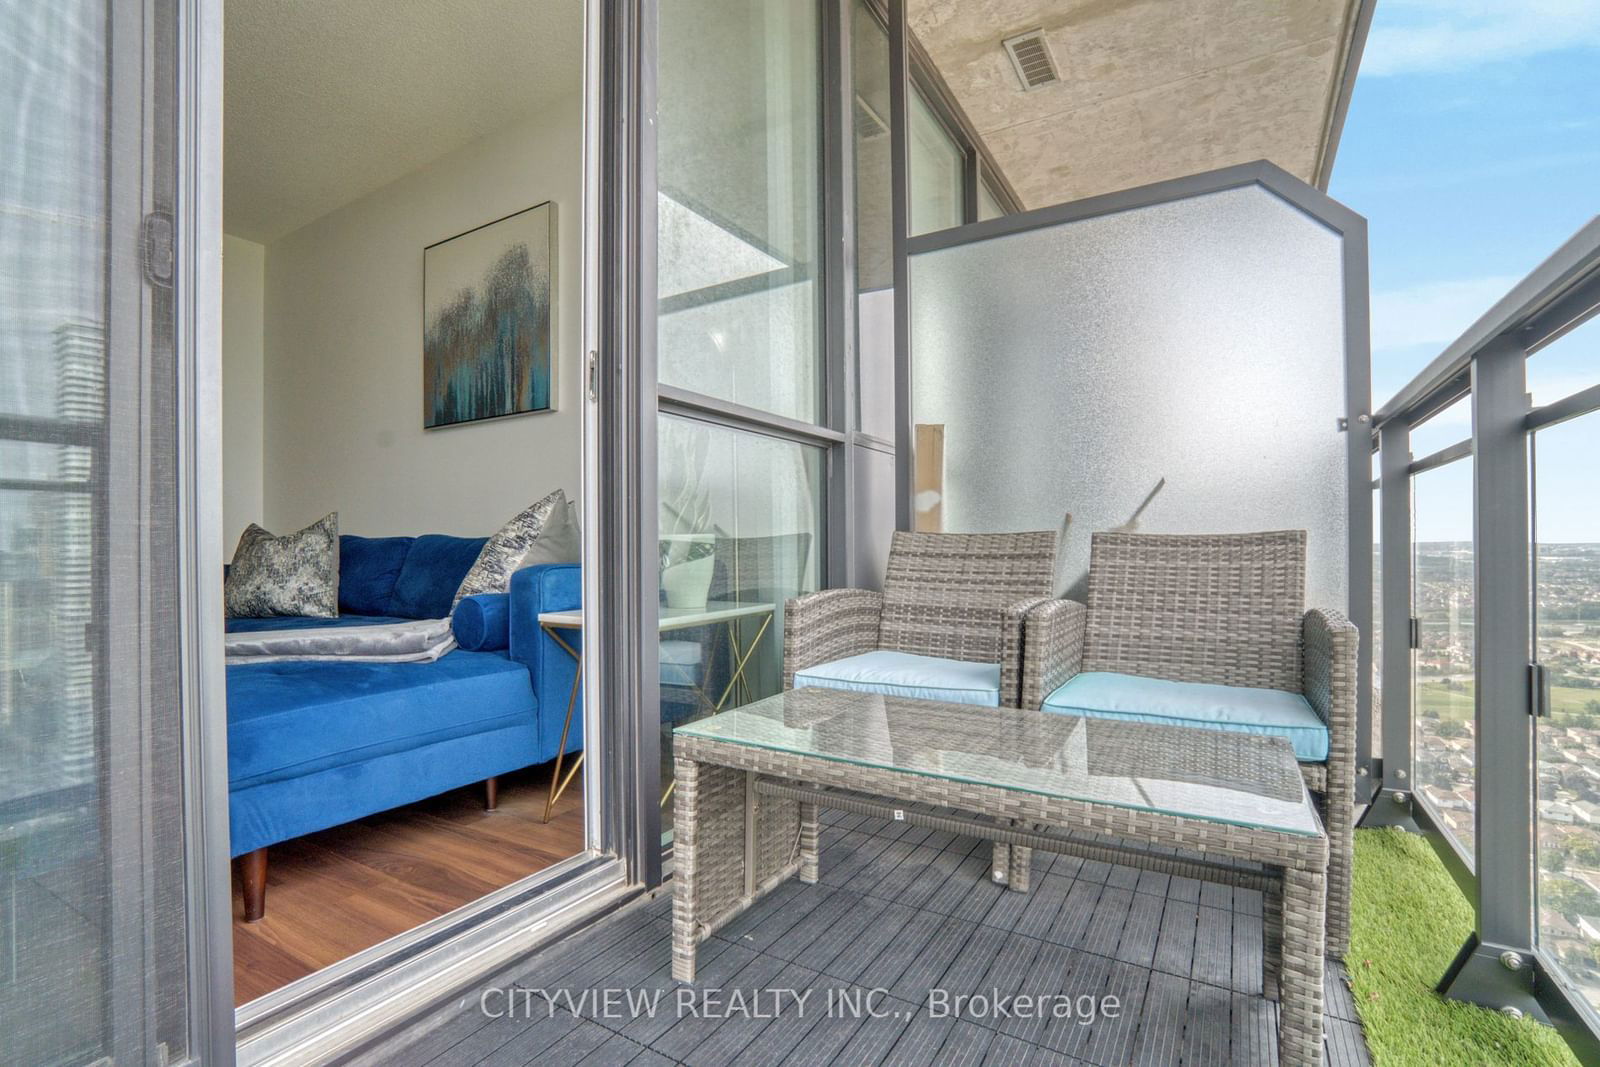
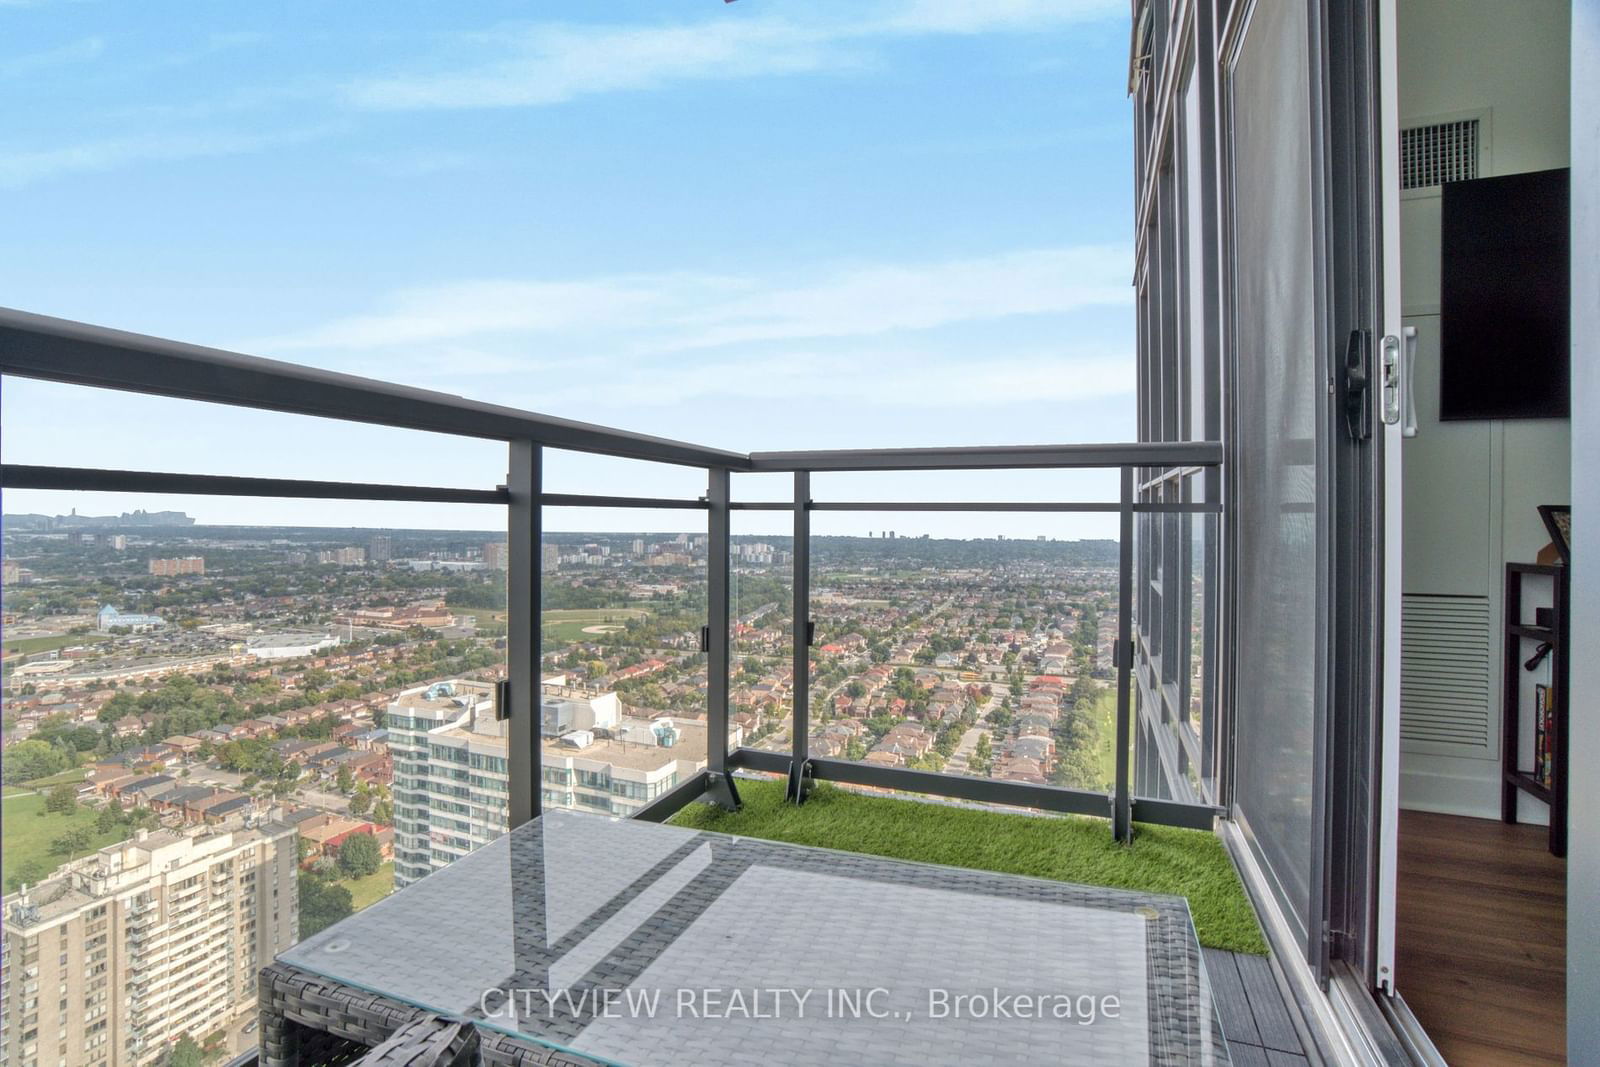
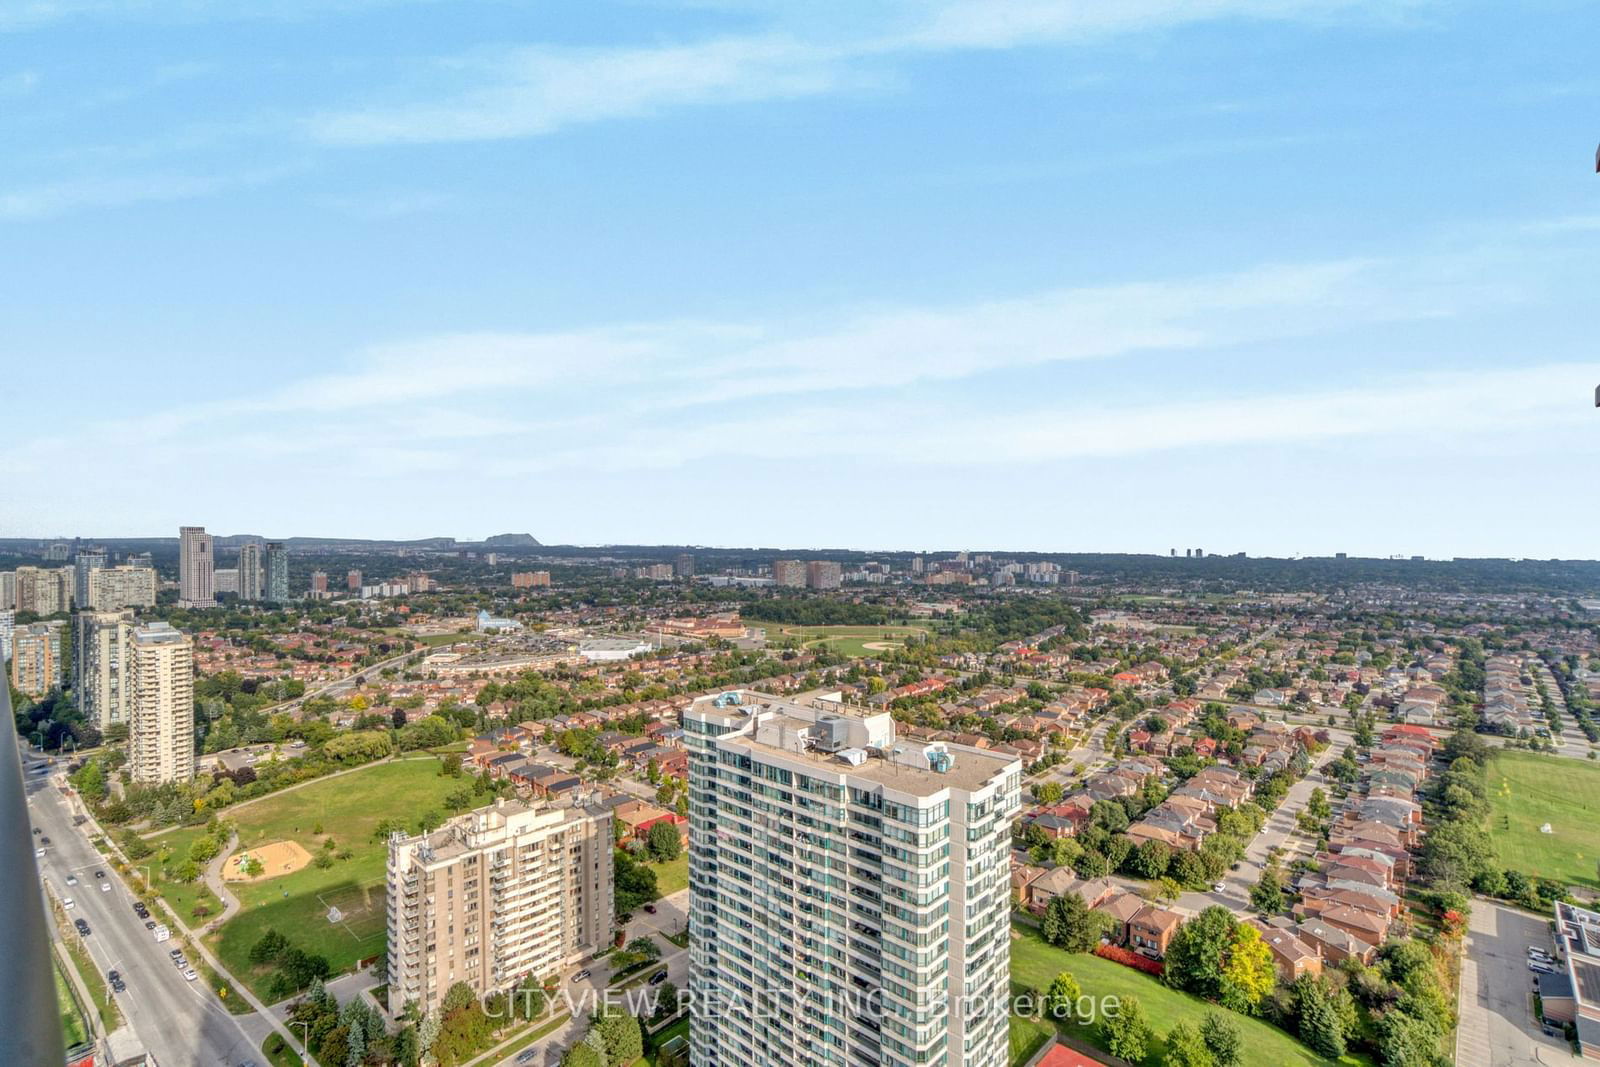
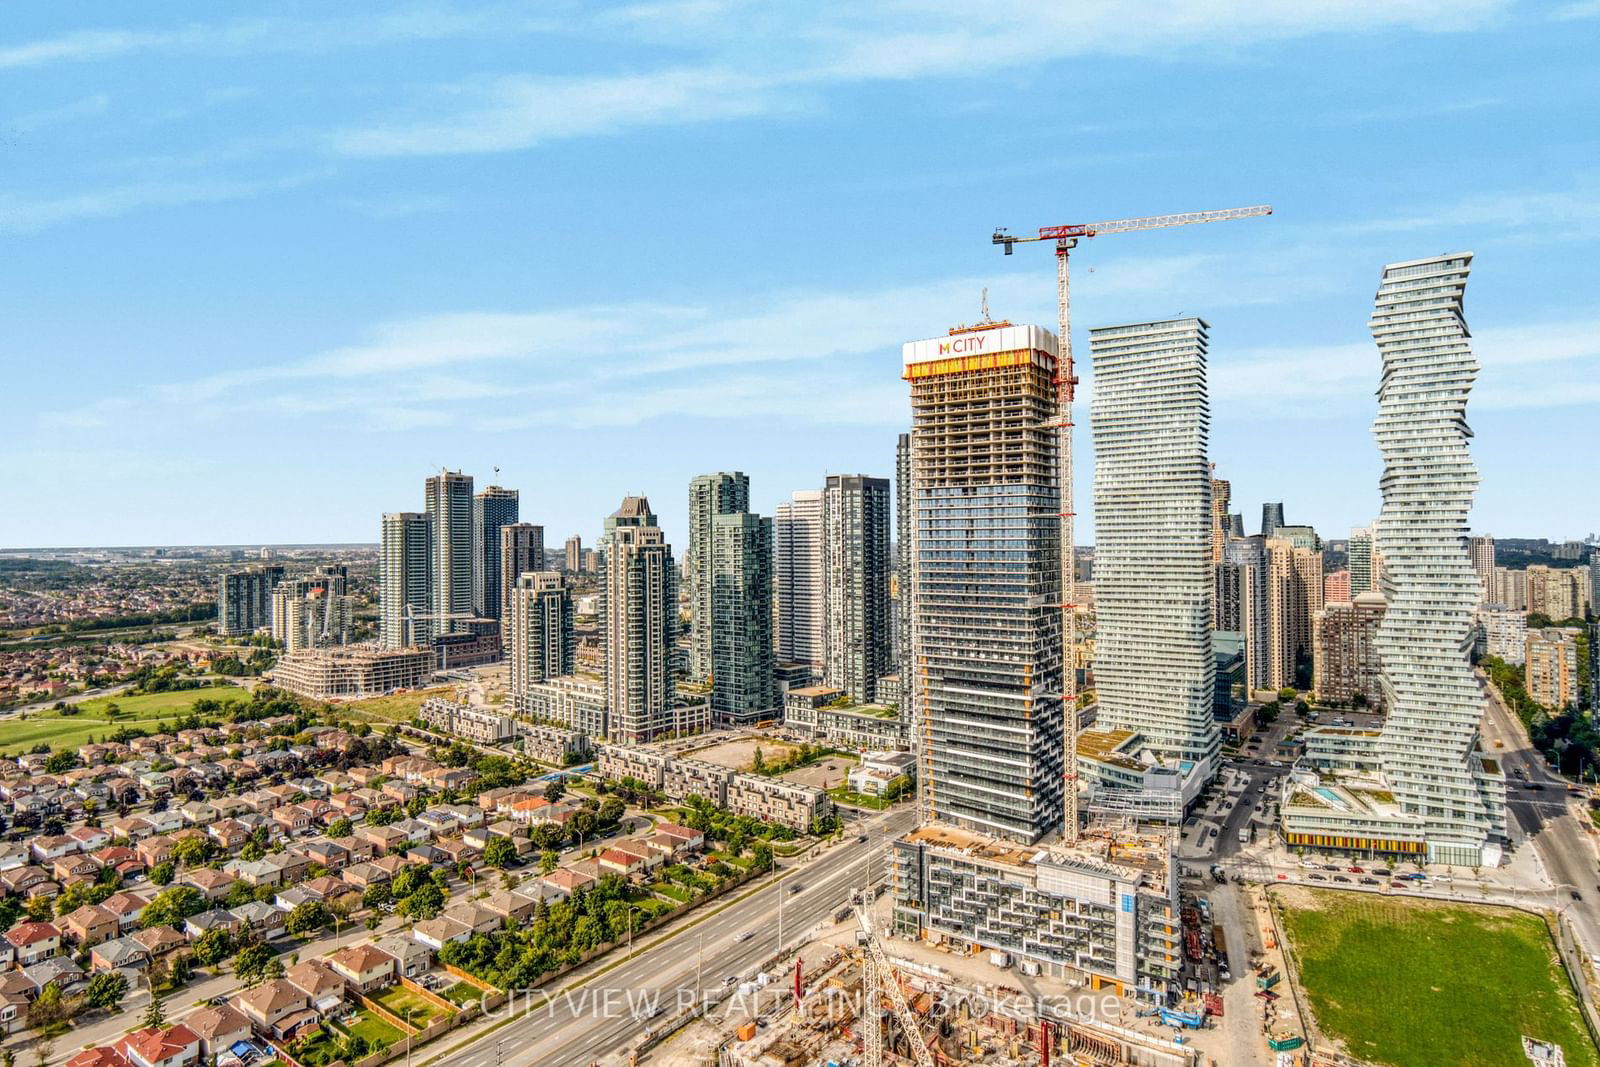
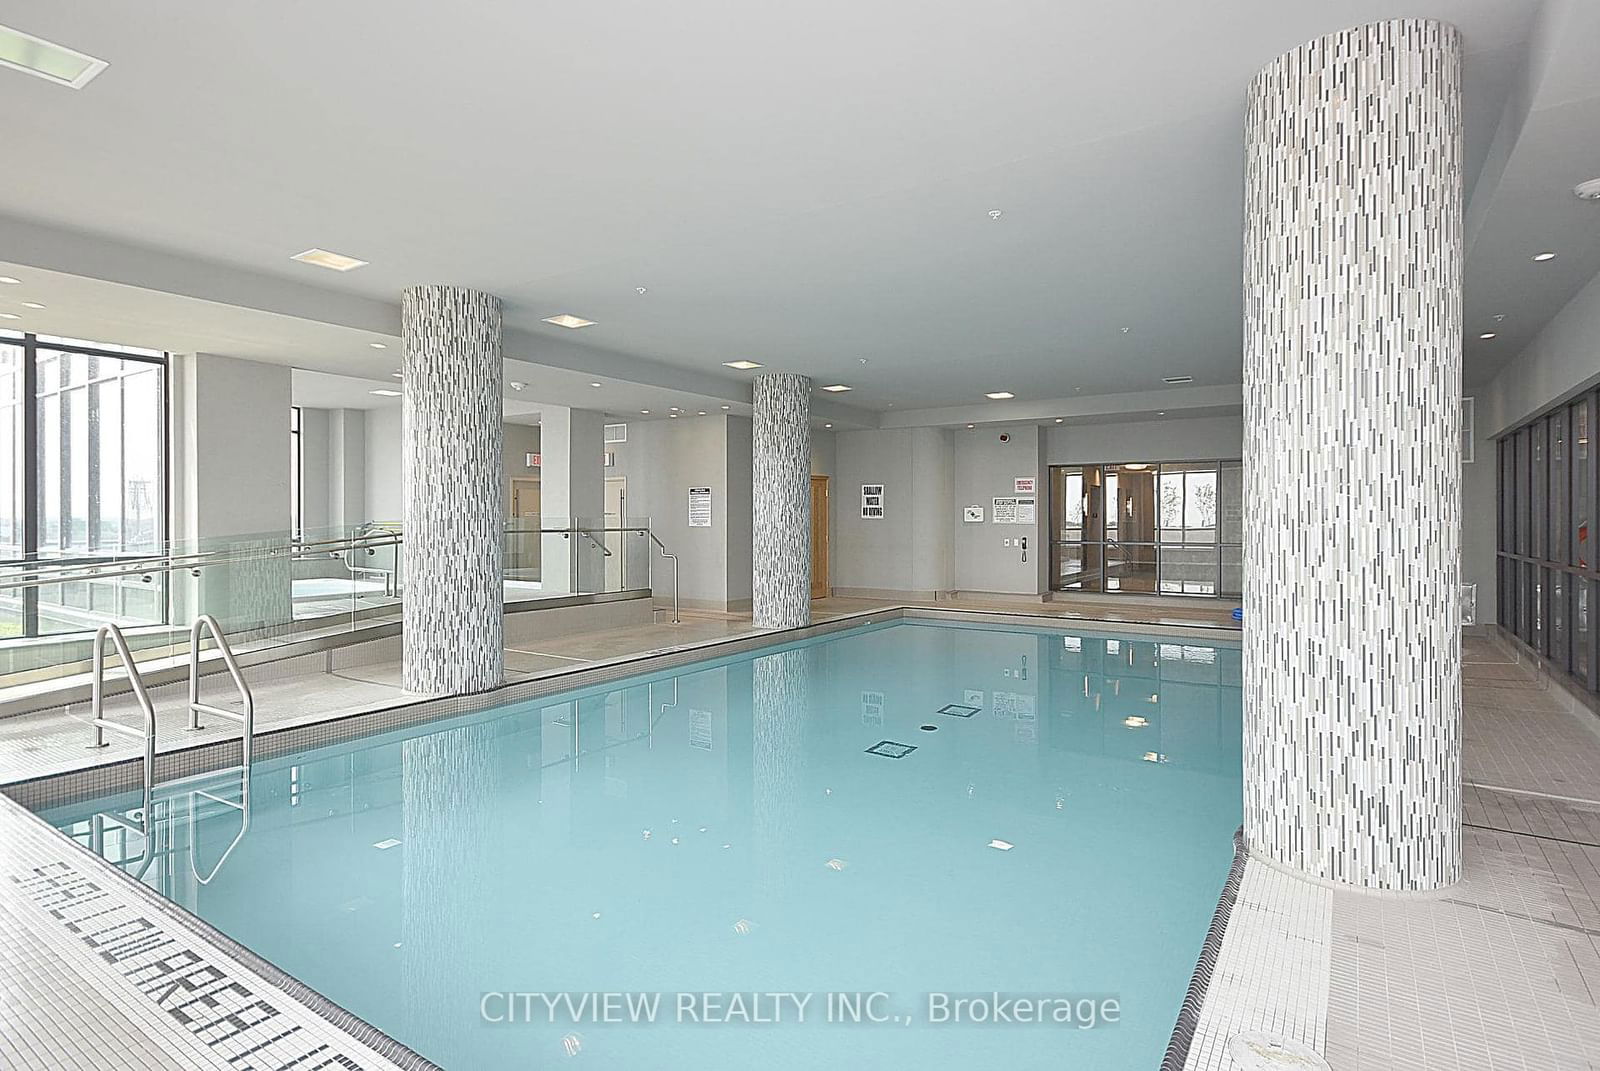
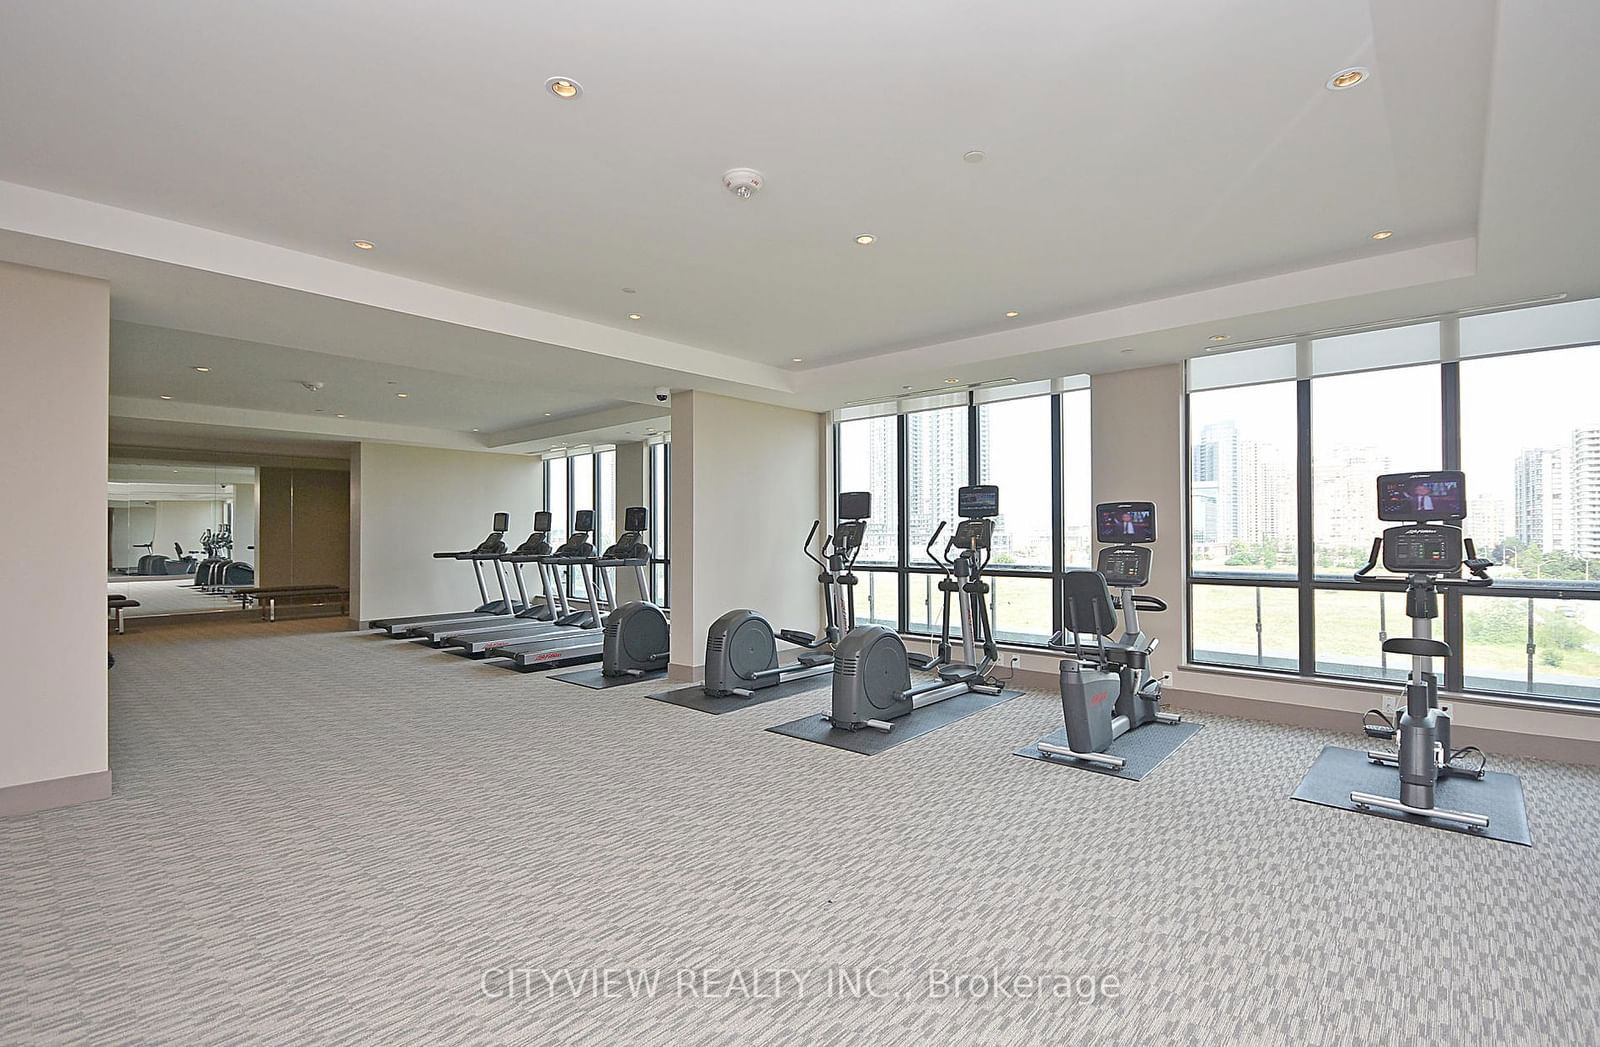
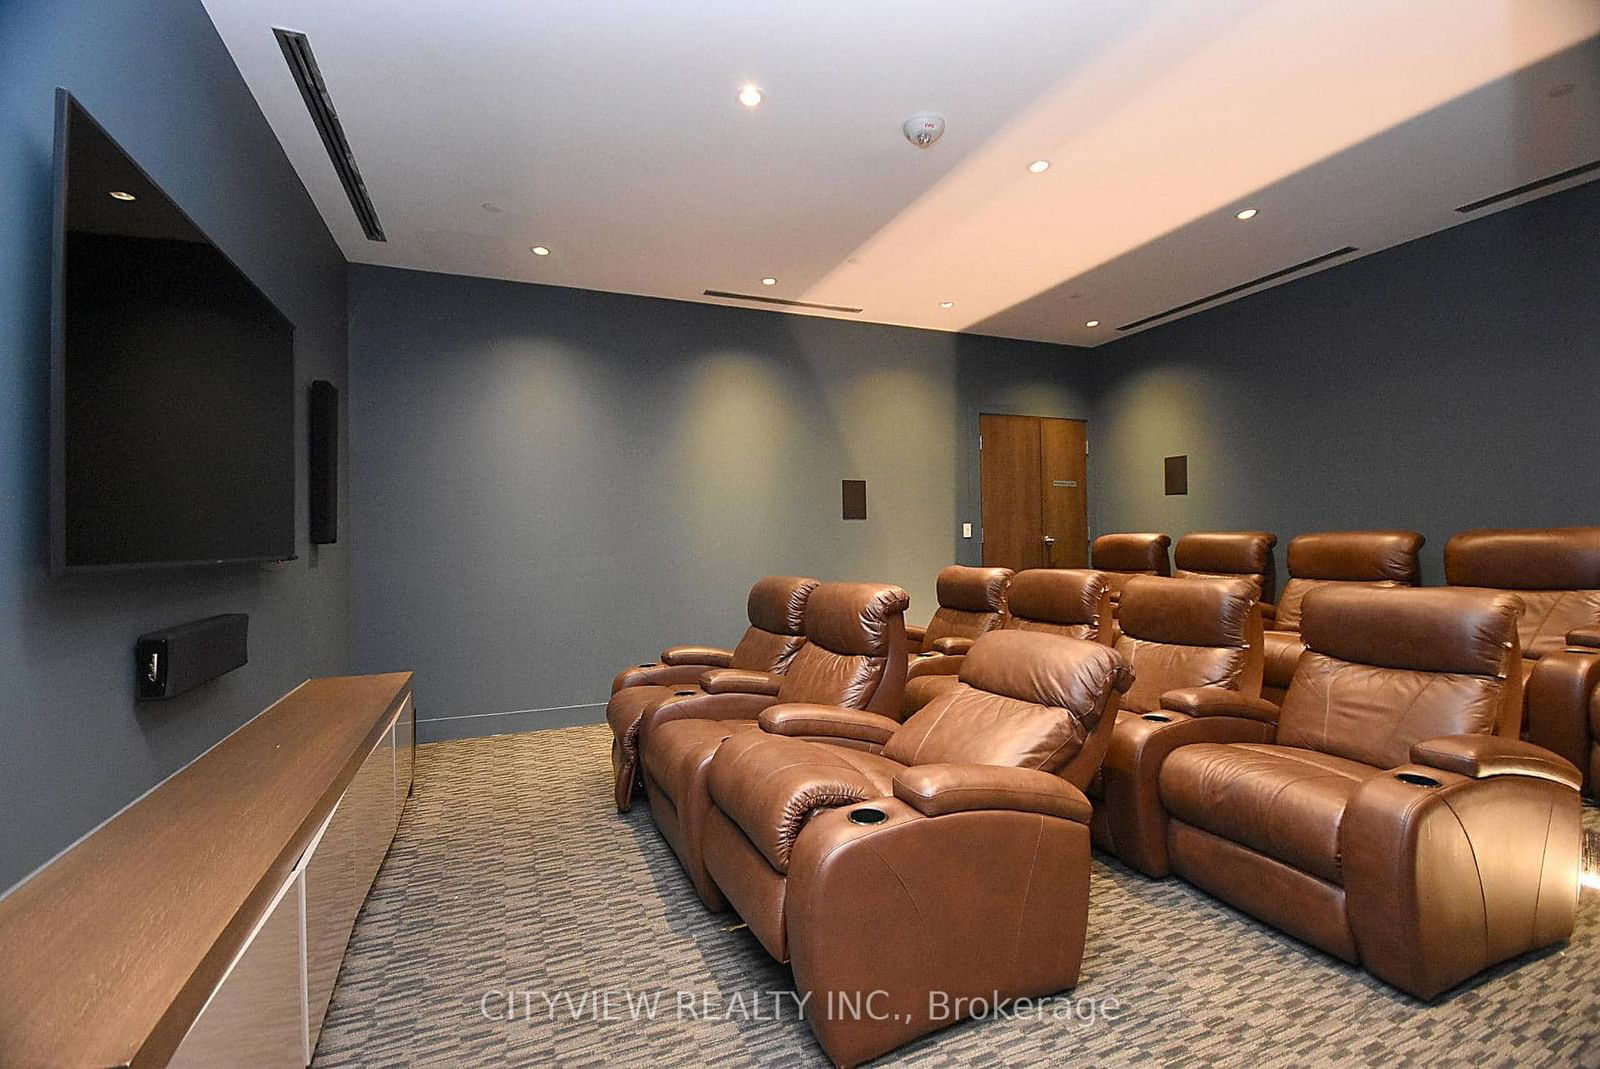
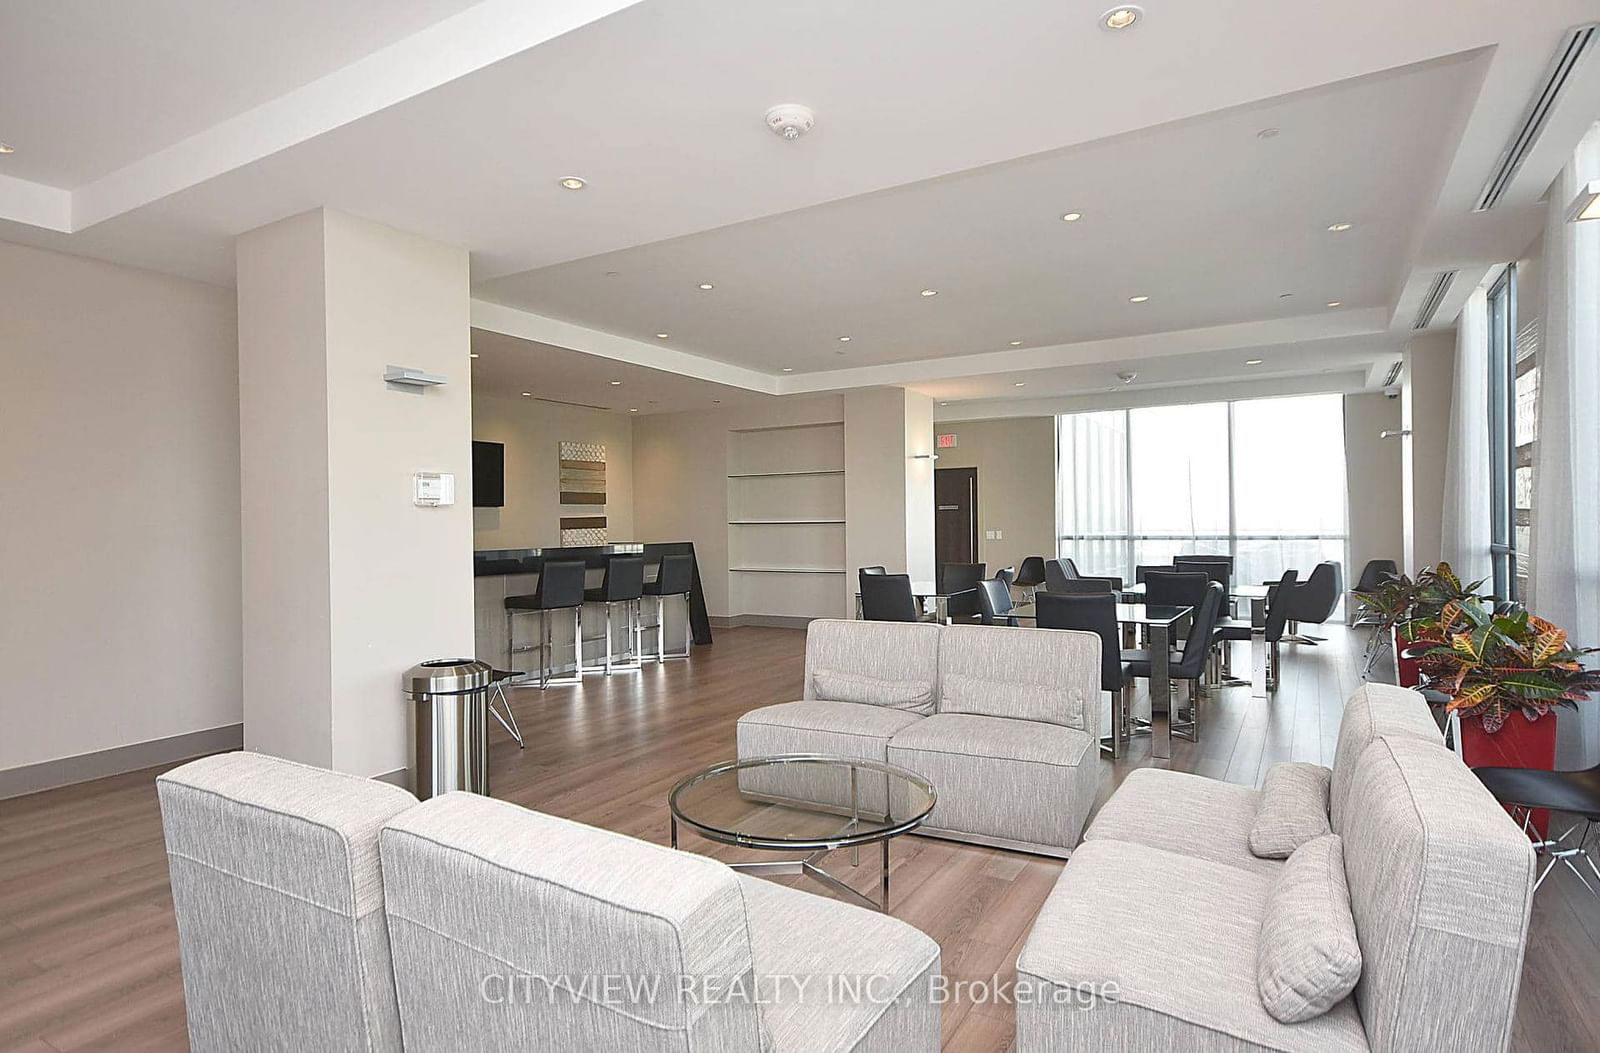
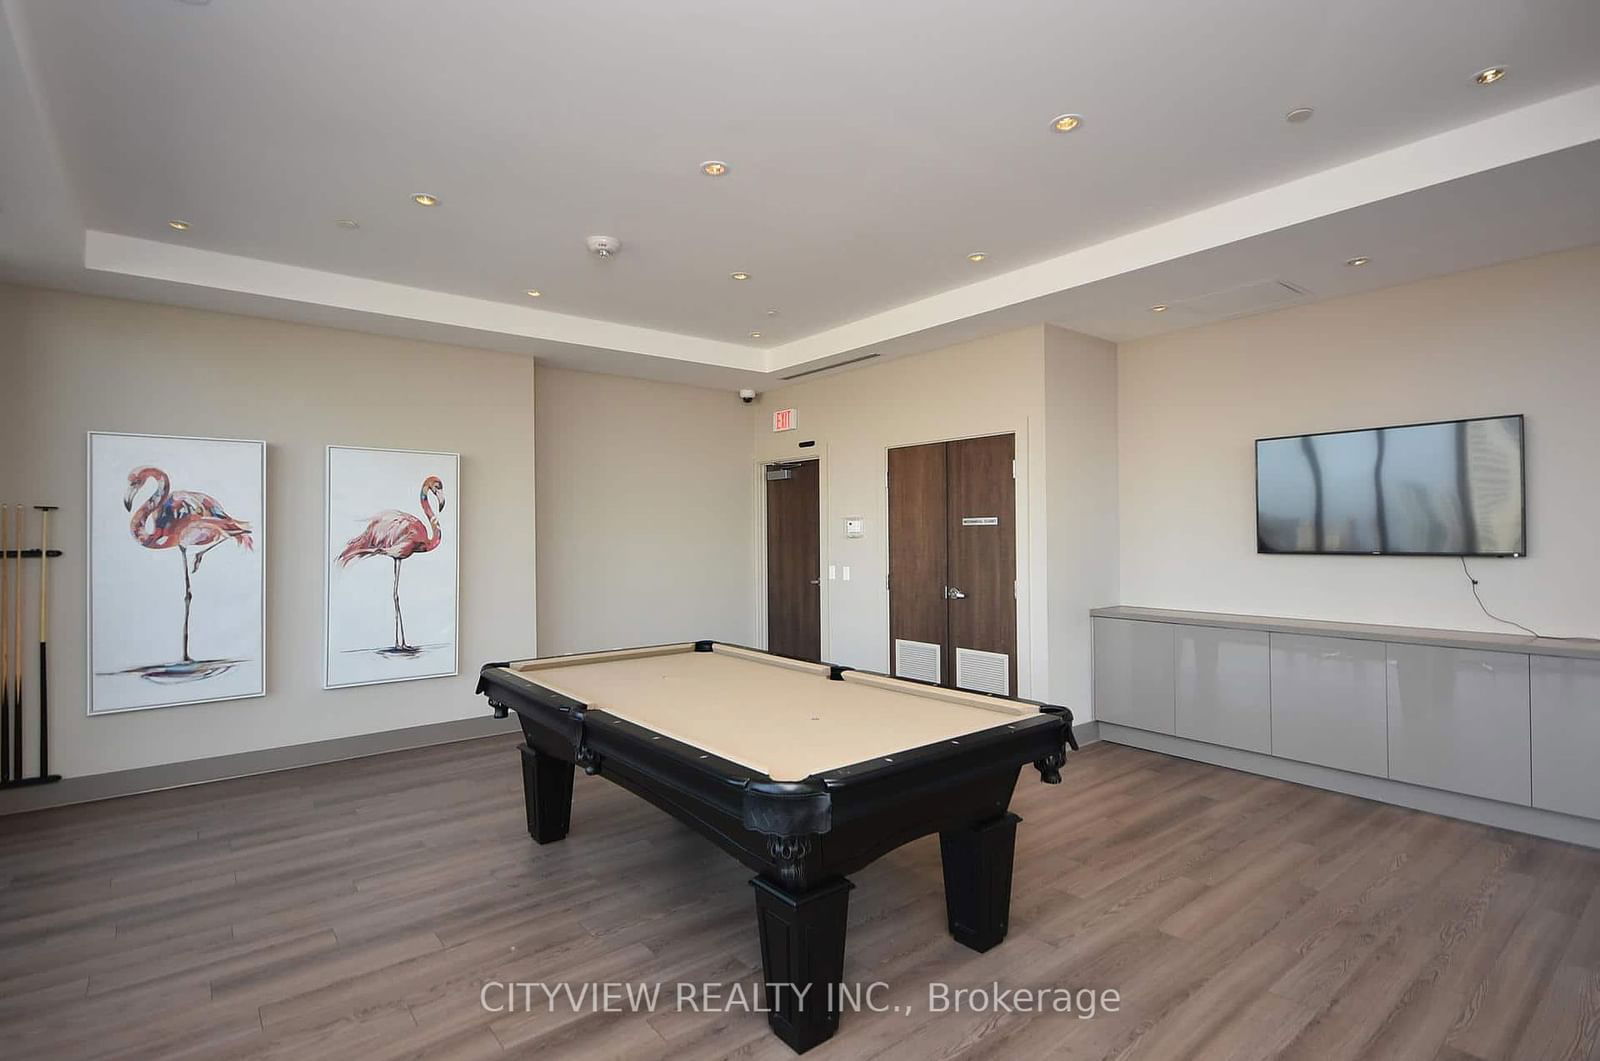
Immaculate move in ready One plus Den Condo in the much sought after Grand Park 2 Tower in the heart of mississauga's downtown core. Unit features laminate flooring throughout open concept living/dining room walking out to an unobstructed South/West view of the lake. Modern kitchen with stainless steel appliances, granite counter tops and tile flooring with breakfast bar. Open Concept Den big enough for an office or to be converted into small bedroom. Spacious primary bedroom with his/hers mirrored closets with a 4pc ensuite with 2 entrances. Close to schools, transit, hospital, shopping & mor! Indoor saltwater pool, gym theatre room, party room, outdoor terrace w/ BBQ and much more.
cityview realty inc.MLS® #W11927474
Amenities
Explore Neighbourhood
Similar Listings
Demographics
Based on the dissemination area as defined by Statistics Canada. A dissemination area contains, on average, approximately 200 – 400 households.
Price Trends
Maintenance Fees
Building Trends At Pinnacle Grand Park II Condos
Days on Strata
List vs Selling Price
Or in other words, the
Offer Competition
Turnover of Units
Property Value
Price Ranking
Sold Units
Rented Units
Best Value Rank
Appreciation Rank
Rental Yield
High Demand
Transaction Insights at 3975 Grand Park Drive
| 1 Bed | 1 Bed + Den | 2 Bed | 2 Bed + Den | 3 Bed | 3 Bed + Den | |
|---|---|---|---|---|---|---|
| Price Range | No Data | $585,000 - $638,000 | $1,185,000 - $1,248,000 | $700,000 - $755,100 | No Data | $1,100,000 |
| Avg. Cost Per Sqft | No Data | $906 | $758 | $770 | No Data | $685 |
| Price Range | $2,348 - $2,500 | $2,400 - $2,650 | $2,800 - $3,500 | $2,900 - $3,550 | $4,300 - $4,500 | No Data |
| Avg. Wait for Unit Availability | 99 Days | 38 Days | 102 Days | 34 Days | 329 Days | 383 Days |
| Avg. Wait for Unit Availability | 28 Days | 14 Days | 44 Days | 19 Days | 211 Days | No Data |
| Ratio of Units in Building | 15% | 35% | 15% | 34% | 3% | 1% |
Transactions vs Inventory
Total number of units listed and sold in Downtown Core
